Facility Portal Guide
Everything your building team needs to get the most out of JockiBox -- from your first question to advanced financial analysis.
Your JockiBox portal is an AI-powered analyst that lives inside your building. It knows your financials, your census, your payor mix, your trends -- and it can answer questions about all of it in plain English. This guide teaches you how to use it.
Your portal is already set up and running. You access it through a web browser at your building's portal URL (e.g., beau.jockivalet.com). You do not need to install anything.
Chapter 00Quick-Start Glossary
Six terms show up throughout this guide. Learn them here and everything else clicks.
| Term | What It Really Means | Why You Care |
|---|---|---|
| Portal | Your building's private AI chat interface -- a website you open in any browser. | This is where you ask questions and get reports. |
| Agent | The AI behind your portal. It has a name (Beau, Atlas, Monty, etc.) and knows your building's data. | When you type a question, the agent reads it, pulls data, and writes the answer. |
| Fabric | Microsoft's data warehouse where your live financial data (wages, revenue, census) flows in from payroll and billing systems. | When the agent says "Fabric Live," it means the number came straight from your real-time data feed. |
| Vena | The financial planning platform where closed-month P&L statements live after accounting finalizes them. | When the agent says "Vena SOT" (Source of Truth), it means the number is the official closed figure. |
| PPD | Per Patient Day -- any dollar amount divided by census days. The universal comparison metric. | PPD lets you compare buildings of different sizes on a level playing field. |
| Model | The AI brain powering the agent. You can switch between a fast brain (Sonnet) and a deep-thinking brain (Opus). | Use Speed mode for quick lookups, Quality mode for complex analysis. |
When you see a dotted underlineThis is how glossary terms appear. Hover any one to see its definition. in this guide, hover over it for a quick definition.
Part I -- Chapter 01What Your Portal Is
Your facility portal is not a chatbot. It is a private AI analyst assigned to your building. It has access to your financial data, your census history, your payor mix breakdown, and your operational metrics -- and it can pull any of that data in seconds, in response to a plain-English question.
What makes it different from ChatGPT
| ChatGPT / Generic AI | Your JockiBox Portal | |
|---|---|---|
| Data | Knows nothing about your building | Has your live Fabric data and closed Vena P&Ls |
| Privacy | Your data goes to a public service | Runs on a Mac Mini in your building -- data stays local |
| Specificity | Generic answers about "the SNF industry" | Answers about YOUR revenue, YOUR census, YOUR trends |
| Output | Text responses only | Charts, KPI dashboards, downloadable reports, split-panel view |
| Memory | Forgets everything when you close the tab | Saves conversation sessions you can return to |
Your portal agent runs on a dedicated Mac Mini physically located in your building. Your data never leaves the device unless you explicitly ask the agent to share something. This is by design -- privacy and speed.
What you can ask it
- Financial: "What was our EBITDAR last month?" / "Show me revenue by payer" / "How does our wage PPD compare to April?"
- Operational: "What's our current census?" / "Break down overtime by department" / "Agency spend this month?"
- Clinical: "What are the CMS requirements for restraint documentation?" / "Summarize Idaho infection control regulations"
- Research: "Search the web for the latest CMS proposed rule on staffing mandates"
- Documents: "Draft a letter to families about our new visiting policy" / "Generate a board-ready financial summary"
Part I -- Chapter 02The Interface
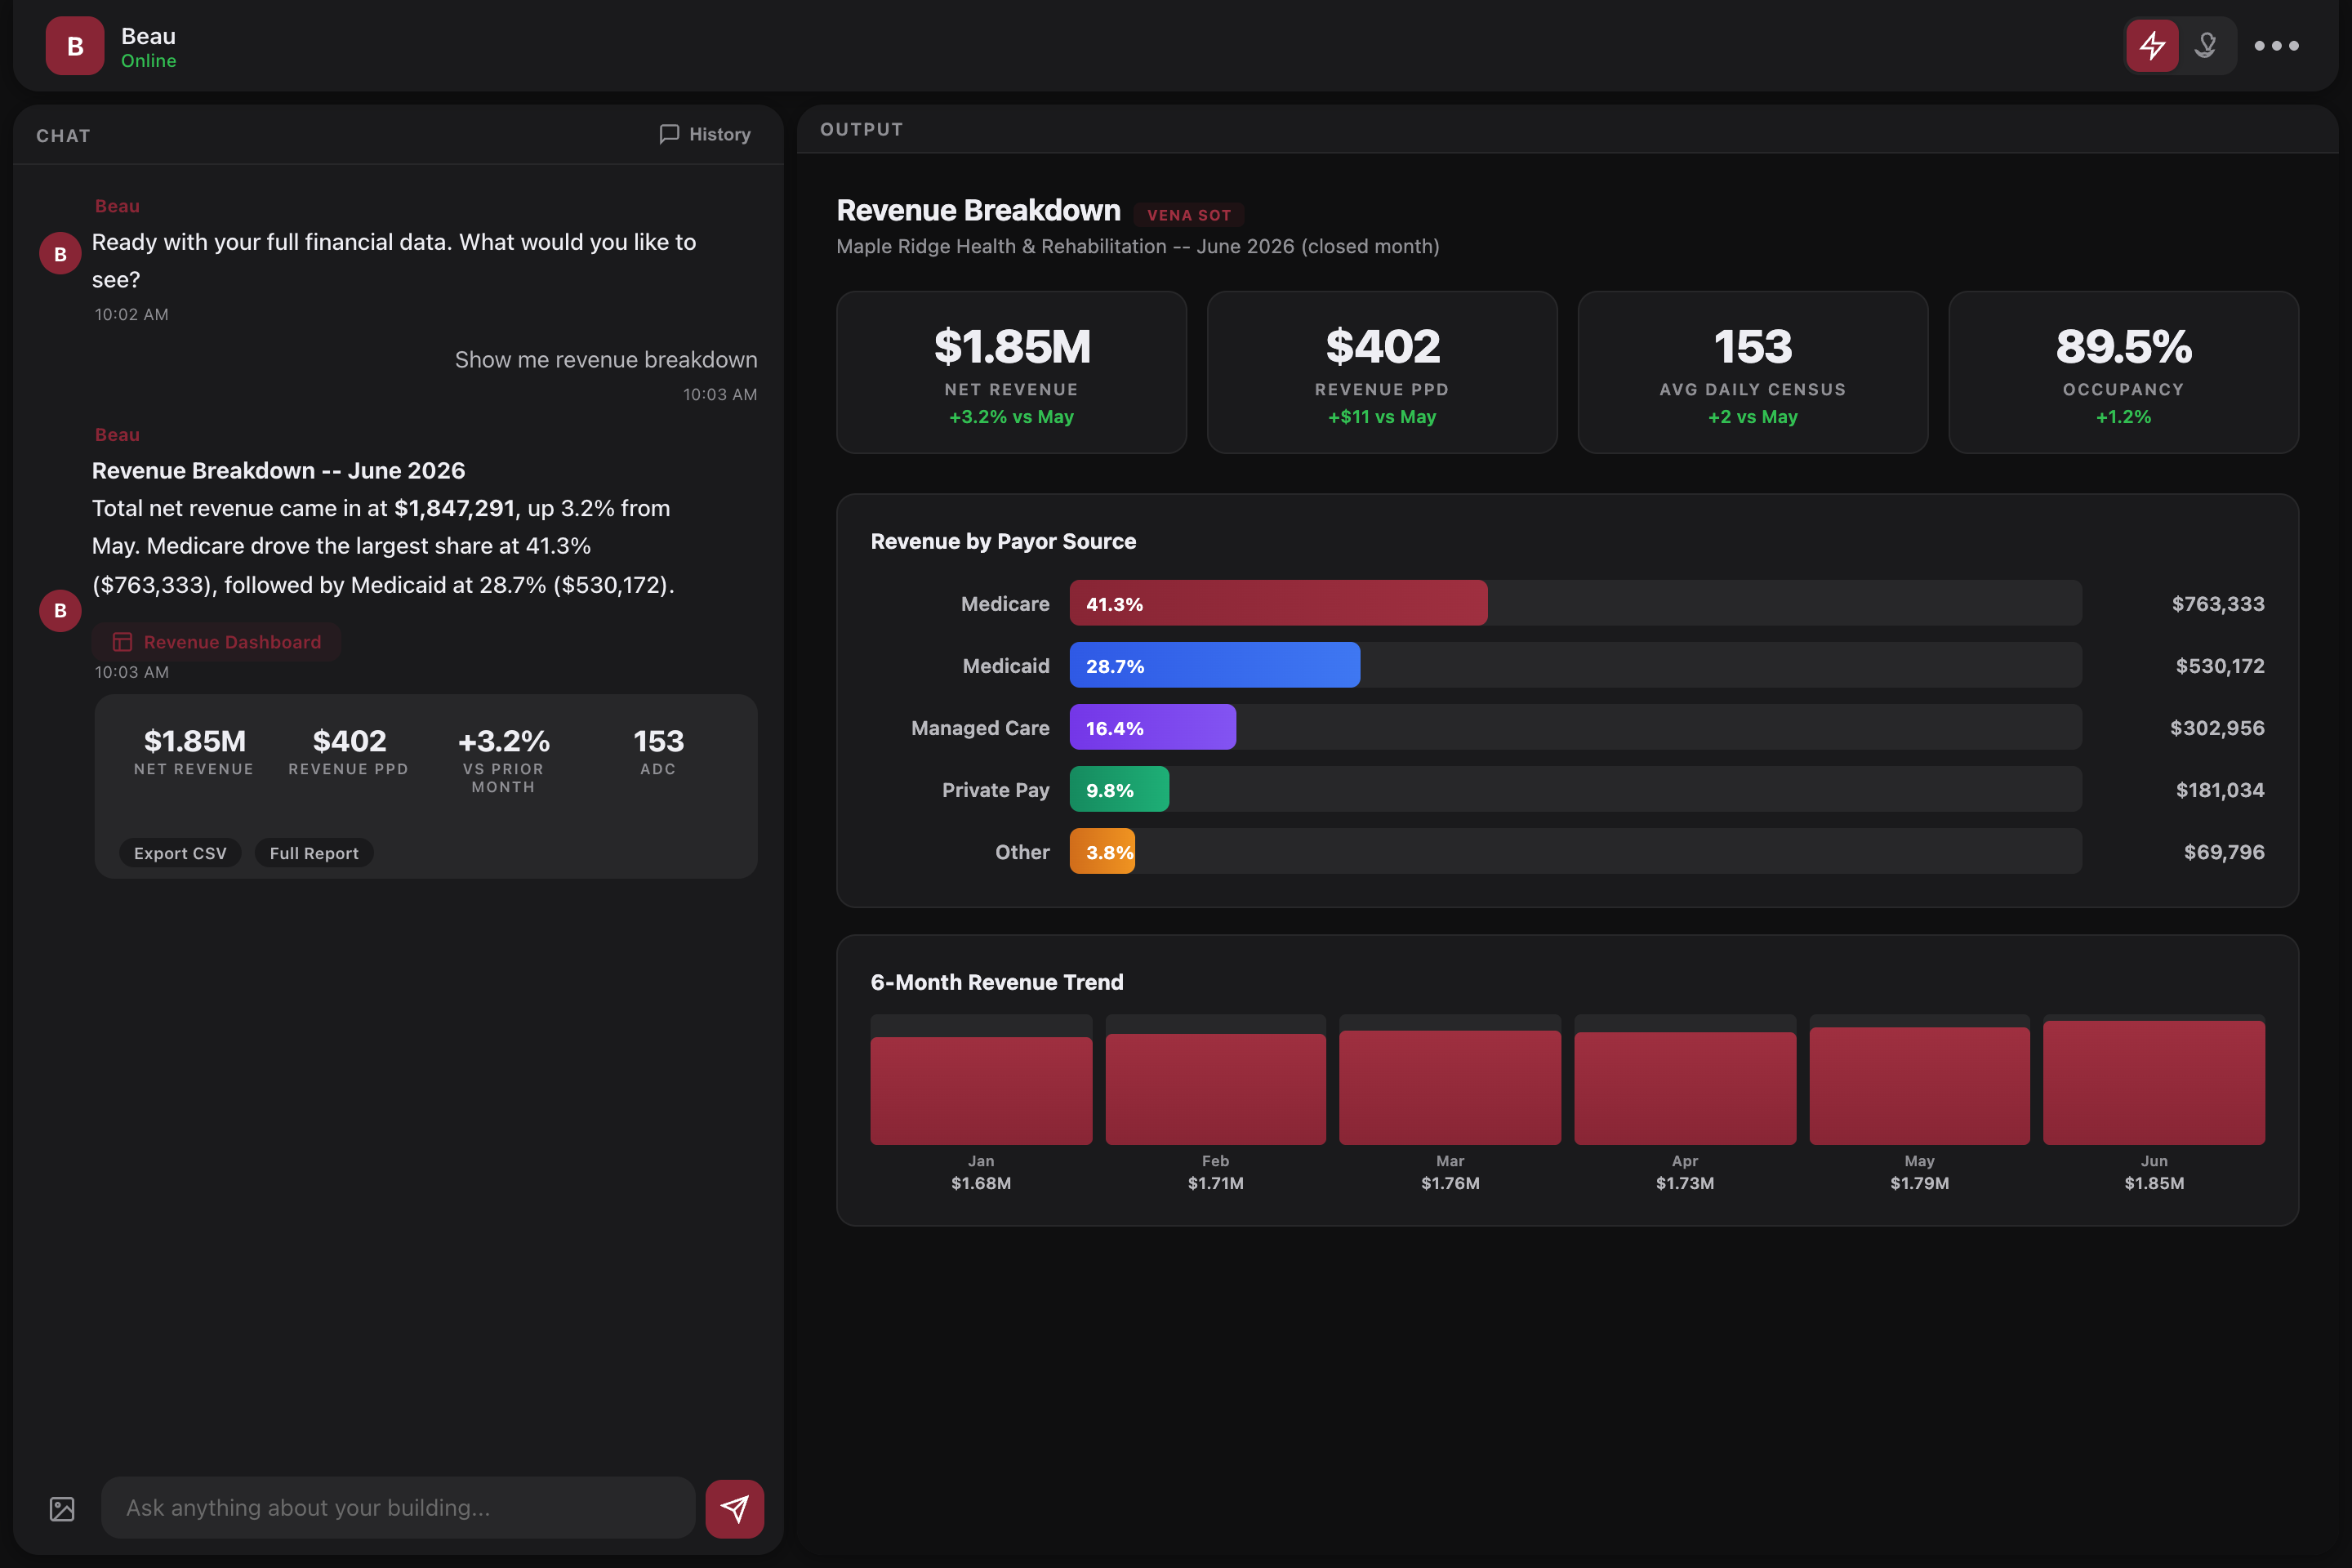
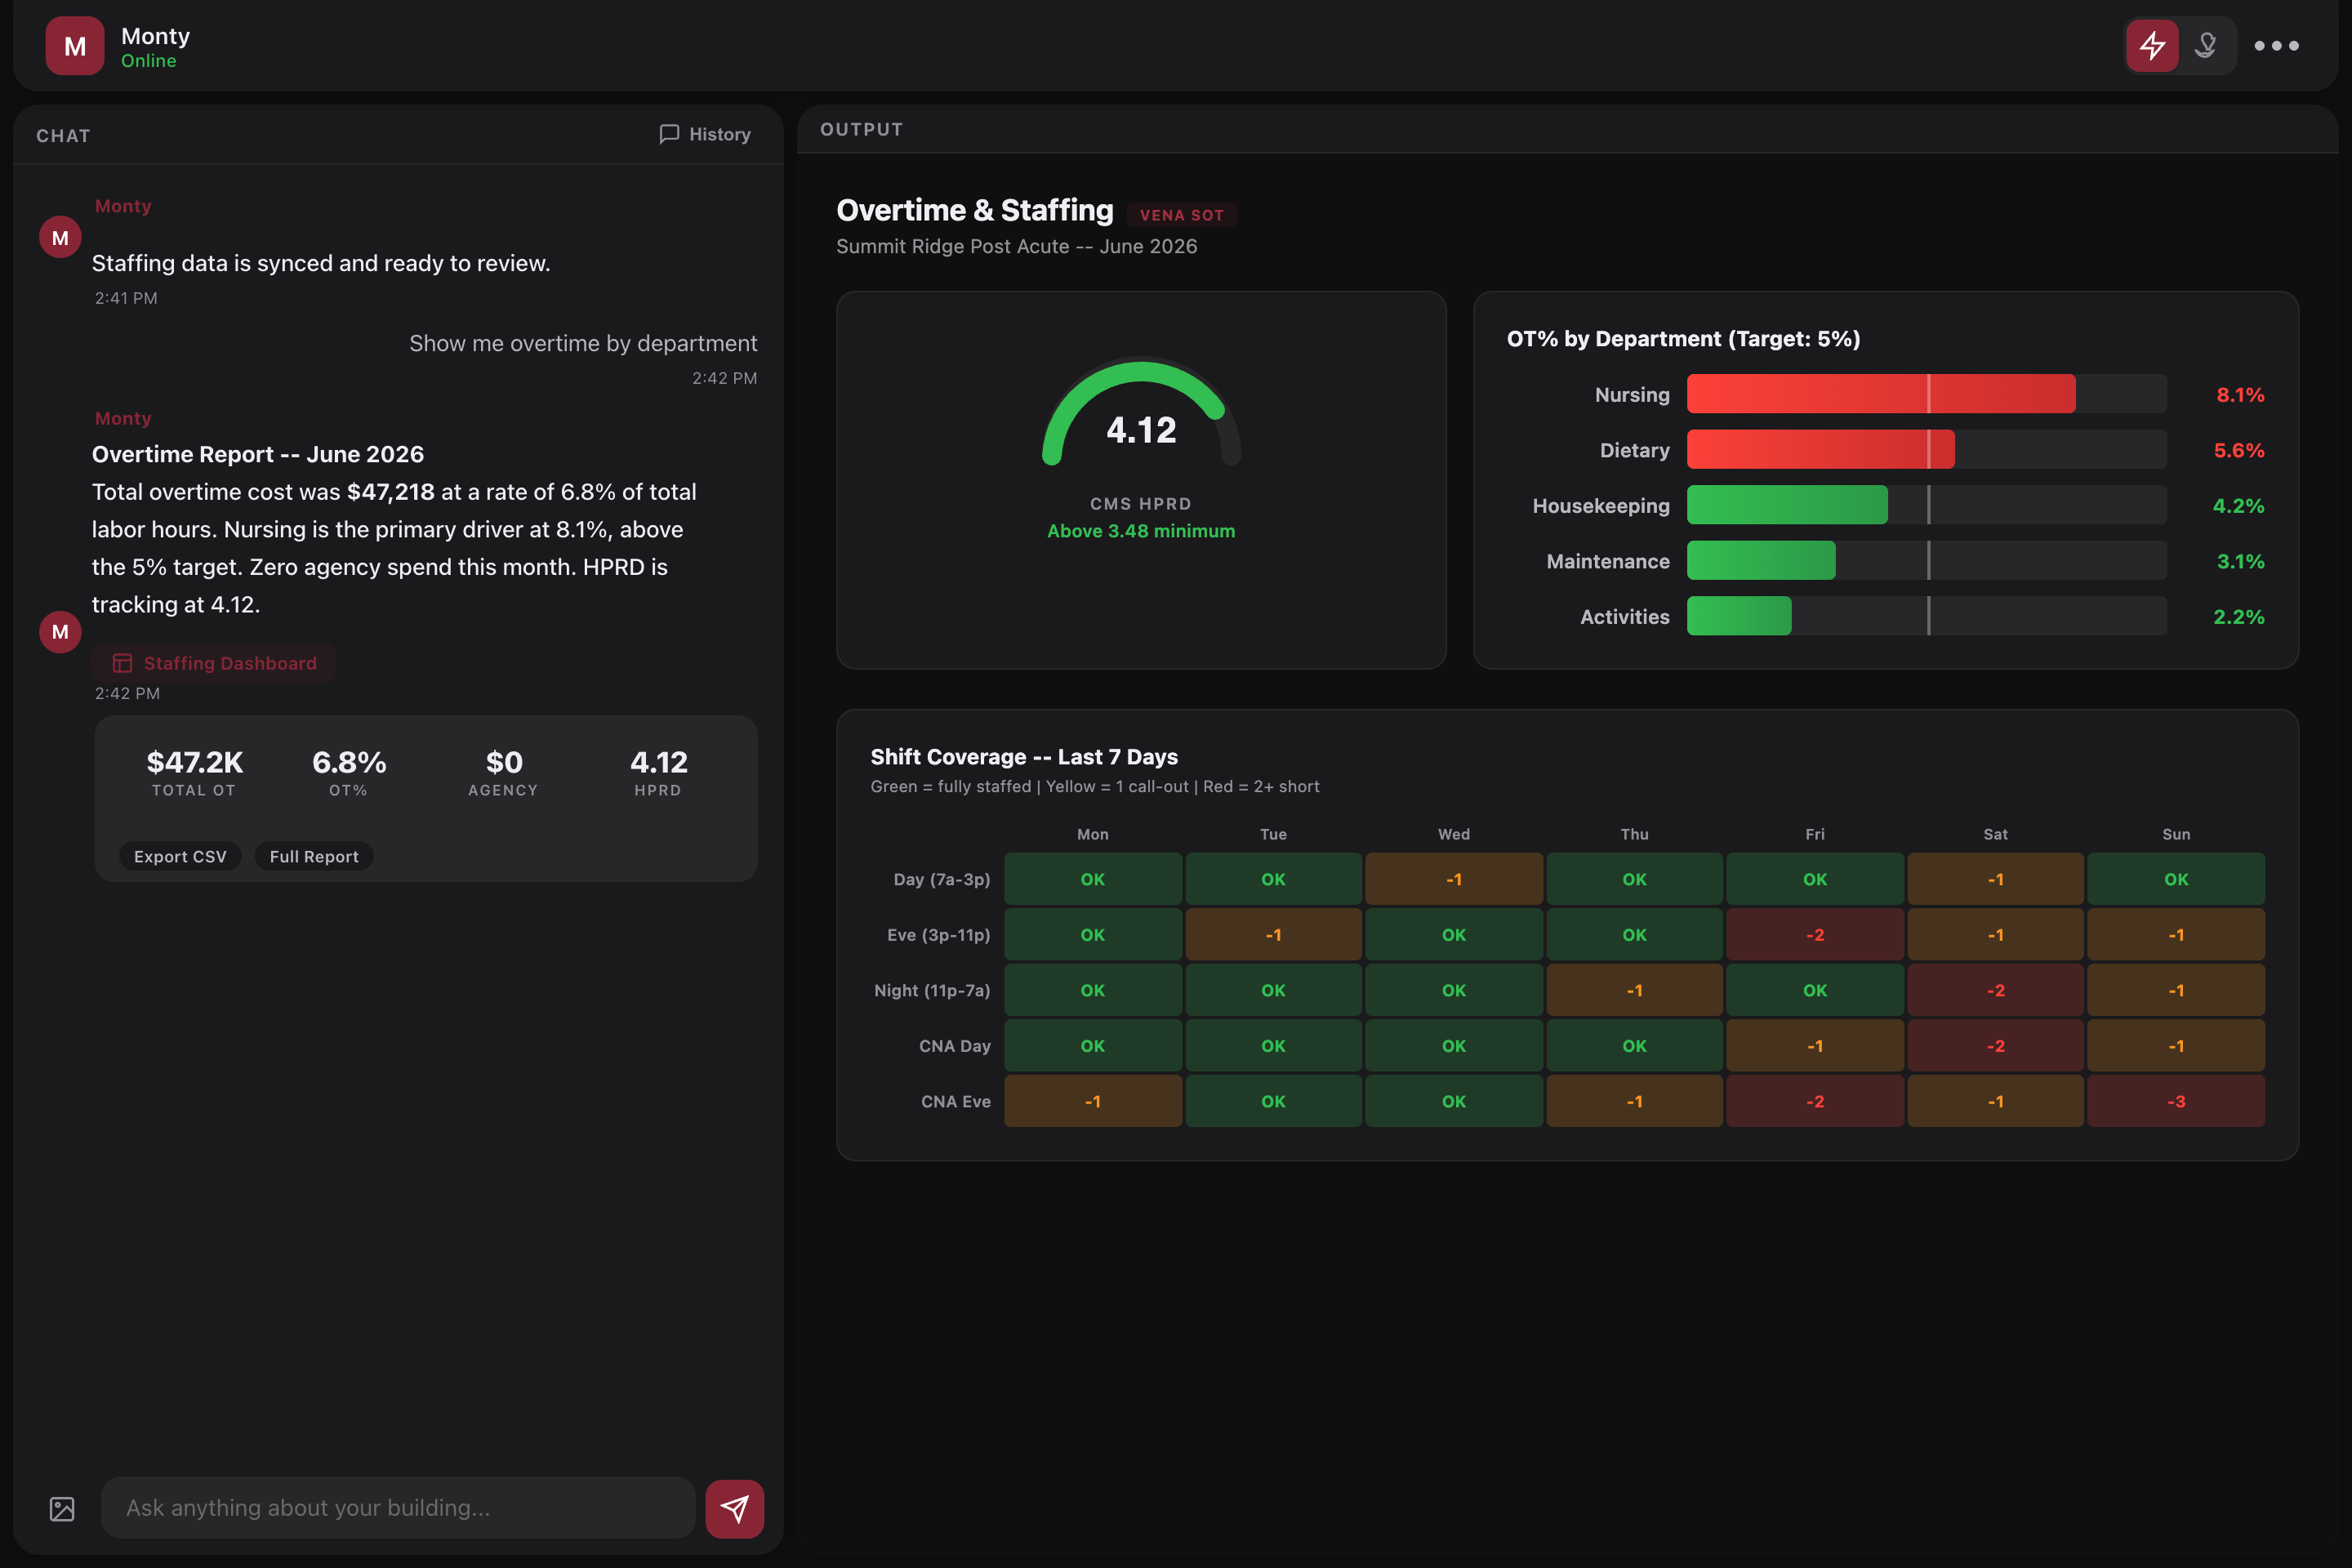
When you open your portal, you see a split-screen layout. The left side is the chat. The right side is the output panel where reports, charts, and dashboards appear.
Part I -- Chapter 02bAnnotated Interface Guide
Every part of your portal interface has a purpose. Hover over the numbered markers below to learn what each zone does.
Try it yourself with the interactive demo below:
The five zones
| # | Zone | What It Does |
|---|---|---|
| 1 | Top Bar | Agent name, online status, model toggle (Speed/Quality), settings, theme switch. |
| 2 | Chat Panel (left) | Where you type questions. Shows the conversation history. Has History and + New buttons. |
| 3 | Output Panel (right) | Where reports, dashboards, charts, and data displays appear. Can be expanded fullscreen. |
| 4 | Input Bar (bottom) | Text input, attachment clip, help button, and the send button. |
| 5 | Data Badges (top right of output) | Show exactly where the data came from -- Fabric Live, Vena SOT, or both. |
Unlike a regular chatbot, your portal has TWO panels. The chat is for conversation. The output panel is for structured data -- dashboards, charts, tables, and reports. When the agent loads a report, it appears on the right automatically.
Part I -- Chapter 02cAsk Me Anything Simulator
Your portal can answer almost any question about your building. Try it below -- type any question and see how the AI responds with data, context, and KPI cards. This is a simulation using de-identified facility data.
Part I -- Chapter 03Model Selection
In the top-right corner of your portal, you will see two small icons in a toggle group. These control which AI brain your agent uses.
| Icon | Mode | Model | Best For |
|---|---|---|---|
| Lightning bolt | Speed | Claude Sonnet 4.6 | Quick lookups, simple questions, "what was census last month," fast drafts |
| Lightbulb | Quality | Claude Opus 4.6 | Complex analysis, multi-step comparisons, strategic recommendations, nuanced writing |
Your portal auto-detects certain keywords and switches to Quality mode when it sees them: compare, analyze, strategic, forecast, trend, recommend, regulatory, compliance, root cause, summarize. You can always override by clicking the toggle manually.
Opus thinks deeper but takes longer -- expect 15-30 seconds for a Quality response vs 5-10 seconds for Speed. Use Speed for most day-to-day questions. Switch to Quality when you need the agent to really think through something.
Part I -- Chapter 03bThe Tools Menu
In the top-right corner of your portal, next to the model toggle and settings, you will see a 3x3 grid icon. This is the Tools menu (sometimes called the waffle menu). Click it to see a dropdown of specialized applications.
Getting Started (live now)
The "Getting Started" tool links to your onboarding guide at /onboarding.html. It walks you through your first session, explains the interface, and covers core capabilities. This is the same guide you are reading now -- accessible any time from the Tools menu.
Coming Soon tools
These tools are being built and will appear in your portal automatically when ready. You do not need to install anything. When a new tool launches, it shows up in your waffle menu the next time you open it.
Part II -- Chapter 04Financial Queries
This is the core of what your portal does. You ask a financial question in plain English, and the agent pulls the data, calculates the metrics, and presents it with context.
What you can ask
Copy any of these into your portal chat and see what comes back:
- "What was our EBITDAR last month?"
- "Show me the P&L for April 2026"
- "How does our revenue compare to the last 6 months?"
- "Break down expenses by GL category"
- "What's our wage PPD trending?"
- "Show me revenue by payer for this month"
- "What was our net income in Q1?"
How the agent answers financial questions
When you ask a financial question, the agent follows a consistent pattern:
- Identifies the time period -- defaults to the most recent available month if you don't specify
- Checks the data source -- uses Vena (closed months) or Fabric (current month live data)
- Pulls the numbers -- revenue, expenses, census, calculations
- Calculates PPD metrics -- automatically divides by patient days for comparison
- Loads a report in the output panel -- KPI cards, charts, and trend data
- Adds context in the chat -- what stands out, what's above/below target, what to watch
Every report shows colored badges in the top-right corner telling you exactly where the data came from:
- Wages: Fabric Live -- real-time from payroll feed
- Revenue: Fabric Live -- real-time from billing feed
- P&L: Vena SOT -- official closed figures from accounting
Part II -- Chapter 05Where the Data Lives
Your portal pulls from two main data systems. Understanding the difference will help you ask better questions and trust the answers.
Microsoft Fabric -- the live feed
FabricMicrosoft Fabric is a cloud data warehouse. Think of it as a giant spreadsheet that automatically receives data from your payroll system, billing system, and census tracking -- updated throughout the day. is where your real-time data lives. Every time payroll runs, every time a claim is processed, every time a patient is admitted or discharged -- that data flows into Fabric.
| What's in Fabric | How Fresh | Example |
|---|---|---|
| Wage data | Updated each payroll cycle | "Total wages MTD: $305,408" |
| Revenue by payer | Updated as claims process | "Medicare revenue: $486,210" |
| Census / patient days | Daily | "ADC: 188, Patient Days: 2,824" |
| Overtime breakdown | Each payroll cycle | "Nursing OT: 11.5%" |
| Agency hours | Each payroll cycle | "Agency hours: 0" |
This means the data is current but may not be final. Revenue numbers in particular can shift as claims are processed and adjusted. Fabric data is your best real-time view, but the final audited numbers come from Vena after the month closes.
Vena -- the source of truth
VenaVena is the financial planning and close platform. When accounting "closes" a month, the final P&L numbers get locked into Vena. These are the official numbers used for board reporting and investor updates. is where the official, closed financial statements live. After accounting closes a month -- typically 10-15 days after month-end -- the final P&L gets loaded into Vena. Those numbers are locked and will not change.
| What's in Vena | When Available | Example |
|---|---|---|
| Full P&L statement | After month close (~day 10-15) | "April EBITDAR: $182,441" |
| GL-level detail | After month close | "GL 62100 Dietary Wages: $31,204" |
| Budget vs actual | After month close | "Revenue vs budget: +3.3%" |
| Historical trend | All closed months | "12-month EBITDAR trend chart" |
During the first two weeks of a new month, you may notice that the current month shows Fabric data while last month still shows Fabric data too (because it hasn't been closed in Vena yet). This is normal. The agent will tell you which source it's using. Once accounting closes the month, the Vena numbers replace the Fabric estimates.
Part II -- Chapter 06Payor Mix Analysis
Your portal breaks down revenue and census by payer type. This is one of the most powerful features for understanding your building's financial health.
The five payer categories
| Payer | What It Is | Typical PPD Range |
|---|---|---|
| Medicare A | Federal insurance, skilled nursing stays. Highest reimbursement. PDPM-driven. | $500 -- $900+ |
| Traditional Medicaid | State insurance, long-term care. Lower reimbursement but high volume. | $200 -- $280 |
| Managed Medicaid | Medicaid through a managed care organization (MCO). Rates vary by contract. | $220 -- $300 |
| Managed Care MCR | Medicare Advantage plans. Contracted rates, often lower than traditional Medicare. | $350 -- $550 |
| Private Pay / Other | Self-pay, VA, insurance. Rates vary widely. | $250 -- $400 |
- "Show me payor mix for this month"
- "What's our Medicare PSD?"
- "Compare payor mix to last quarter"
- "Which payer has the highest PPD?"
- "How many Medicare A days do we have MTD?"
Part II -- Chapter 07PPD and PSD
Per Patient Day (PPD) is the most important metric in skilled nursing finance. It normalizes every dollar by the number of patients, making buildings of different sizes directly comparable.
The formulas
Benchmarks
| Metric | Formula | Good Range (SNF) | Watch If |
|---|---|---|---|
| Revenue PPD | Net Revenue / Census / 30 | $300 -- $500 | Below $300 (payer mix issue) or declining month-over-month |
| Wage PPD | Total Wages / Census / Days Elapsed | $90 -- $130 | Above $130 (OT, agency, or staffing model issue) |
| EBITDAR PPD | EBITDAR / Census / 30 | $30 -- $80 | Below $30 (margin compression) or negative |
| Medicare PSD | Medicare Rev / Medicare Days | $500 -- $900+ | Below $500 (PDPM coding opportunity) |
Part II -- Chapter 07cSpeed Challenge
How fast can your portal answer a financial question? Try it and see how JockiBox compares to the old way of pulling data from spreadsheets.
Part II -- Chapter 07bWhat-If Calculator
Adjust census and payor mix to see how changes affect your bottom line. All calculations use real facility data.
Part III -- Chapter 08Census and Operational Metrics
Beyond financials, your portal tracks operational data that directly impacts your bottom line.
Census data
- ADC (Average Daily Census) -- the average number of patients per day. Your most fundamental volume metric.
- Patient Days -- total days of care delivered in the period. Census x Days = Patient Days.
- Admissions / Discharges -- when available from the census feed, shows patient flow.
- Payer Days -- patient days broken down by payer type (Medicare, Medicaid, etc.)
Staffing and labor
- Overtime % -- OT wages as a percentage of total wages. Target: 5% or less.
- Agency Hours -- contract/temp staffing hours. Target: zero.
- Department Breakdown -- OT and wages split by Nursing, Housekeeping, Dietary, Maintenance, Activities, Admin.
- HPRD (Hours Per Resident Day) -- when staffing data is available, shows nursing hours per patient per day.
- "What's our overtime percentage this month?"
- "Break down OT by department"
- "Do we have any agency spend?"
- "What's our census trend for the last 6 months?"
- "Show me ADC by payer type"
Part III -- Chapter 09Clinical and Regulatory
Your portal can answer questions about clinical regulations, CMS requirements, state-specific rules, and compliance standards. It uses web search to find current information.
What it can help with
- CMS regulations -- F-tags, survey requirements, conditions of participation
- State-specific rules -- Idaho, Washington, Oregon, Montana, Arizona licensing and compliance
- Infection control -- protocols, reporting requirements, outbreak response
- Staffing requirements -- minimum staffing ratios by state, CMS proposed rules
- Documentation standards -- care plans, MDS coding, PDPM optimization
When you ask a clinical or regulatory question, the agent searches the web for current information. This means it can find the latest CMS proposed rules, recent state regulatory changes, and updated guidance. However, always verify critical regulatory decisions with your compliance officer or legal team.
- "What are the Idaho requirements for RN coverage?"
- "Summarize the latest CMS staffing mandate proposal"
- "What F-tags relate to fall prevention?"
- "Draft an infection control policy for respiratory illness"
Part IV -- Chapter 10Session Management
Your portal remembers conversations. Each conversation is a "session" that you can return to later, start fresh, or let the agent manage automatically.
How sessions work
| Action | How | What Happens |
|---|---|---|
| Start a new conversation | Click the + button in the chat header | Fresh session, clean context. The agent starts with no prior conversation loaded. |
| View conversation history | Click History in the chat header | See all saved sessions. Click one to reload it. |
| Continue a session | Just keep typing | The conversation continues from where you left off. |
As conversations get long (40+ messages), the agent automatically summarizes older messages to keep things fast. You won't notice this happening -- the agent maintains context while keeping the conversation responsive. If a session gets very long, start a new one for best performance.
Start a new session when you switch topics. "April financials" is one session. "Staffing analysis" is another. This keeps the agent focused and prevents old context from confusing new questions.
Part IV -- Chapter 11Troubleshooting
Things that might go wrong and what to do about them.
| Problem | Cause | Fix |
|---|---|---|
| Portal won't load | Mac Mini is off or network issue | Check that the Mac Mini under your desk has a green light. If it's off, press the power button. If it's on but the portal still won't load, contact Will or Owen. |
| Agent says "data not available" | Data pipeline hasn't run yet or the month hasn't been closed | Check the data badges. If you see no badges, the data file may be stale. The pipeline runs nightly at 3 AM. If it's been more than 24 hours, escalate to Will. |
| Slow responses | Quality mode or complex query | Switch to Speed mode (lightning bolt) for faster answers. Quality mode (lightbulb) takes 15-30 seconds. |
| Numbers look wrong | Data source mismatch or mid-month estimates | Check the data badges. Fabric Live numbers are estimates that may change. Vena SOT numbers are final. If Vena numbers look wrong, escalate to accounting. |
| Agent seems confused | Long conversation or mixed topics | Start a new session (click +). This gives the agent a fresh context. |
| "Report loaded in panel" but panel is empty | Browser rendering issue | Click the expand icon in the output panel header, or refresh the page. |
If something is broken and you can't fix it with the steps above:
Step 1: Message Will Merrick
Step 2: If Will is unavailable, message Owen Hammond
Step 3: The system will also auto-escalate if it detects a problem
Part IV -- Chapter 12Tips and Best Practices
Ask like you're talking to a new analyst
The more specific your question, the better the answer. Compare:
| Vague (OK) | Specific (Better) |
|---|---|
| "How are we doing?" | "What was our EBITDAR margin last month vs budget?" |
| "Show me the numbers" | "Show me revenue by payer for May 2026" |
| "Any issues?" | "Is overtime above 5% in any department this month?" |
| "What about staffing?" | "Compare nursing hours per resident day to the state minimum" |
Power user moves
- Multi-line input: Press
Shift+Enterto add a line break without sending. PressEnteralone to send. - Paste context: You can paste a full email, memo, or data table into the chat and ask the agent to analyze it.
- Request specific formats: "Show me that as a table" or "Give me a chart" or "Make it a one-page summary I can print."
- Ask for comparisons: "Compare May vs April" or "How does this month compare to the same month last year?"
- Follow up: After getting a report, ask follow-up questions. "Why is OT so high?" or "What's driving that increase?"
You don't need to repeat context. If you asked about May revenue and then want to know about May expenses, just say "now show me expenses." The agent knows you're still talking about May.
Part IV -- Chapter 12bYour Morning Routine
Here is what a typical morning looks like for a building president using JockiBox. Walk through all five steps to see how 8 minutes with your portal prepares you for the entire day.
Knowledge ChecksTest What You Learned
Part V -- Chapter 13Advanced Building Intelligence
Your portal does far more than answer financial questions. It can generate board-ready reports, scan invoice batches, optimize staffing, analyze incident trends, audit compliance readiness, and model payor mix scenarios -- all through the same conversational interface.
The demo below shows the full range of what your building-level AI can do. Click any scenario chip to see the kind of output your portal produces.
Notice the lightbulb (Opus) is active in the demo above. Report generation, compliance audits, and multi-source analysis automatically engage Quality mode for deeper reasoning. The portal switches on its own -- you do not need to toggle manually.
Part V -- Chapter 14Document and Data Capabilities
Your portal can process, analyze, and generate a wide range of documents and data types. Here is what it handles today:
When you upload documents for analysis, the data is processed on your building's local Mac Mini. Documents are not sent to external services -- the AI runs the analysis locally using the same private infrastructure that powers your financial queries.
Training Complete
You've completed all 14 chapters and knowledge checks for the JockiBox Facility Portal.
← Back to Training Home | Executive Portal Guide →
JockiBox -- Cascadia Healthcare | July 2026