Executive Portal Guide
Fleet-wide financial intelligence, cross-building analysis, strategic modeling, and portfolio reporting -- all from one chat interface.
The Executive Portal gives you portfolio-wide visibility across every Cascadia facility. Where a building president sees their single building, you see all of them -- side by side, in real time, with the ability to drill into any one.
The Executive Portal runs at your designated portal URL (e.g., tbot.jockivalet.com, sap.jockivalet.com, or jbot.jockivalet.com). Each executive portal is assigned to a specific leadership role. Your portal knows who you are and what you need.
Chapter 00Executive vs Facility Portal
Both portals use the same AI engine and the same data. The difference is scope and capability.
| Facility Portal | Executive Portal | |
|---|---|---|
| Data scope | Single building only | All Cascadia facilities -- every building in the portfolio |
| Comparisons | Your building vs budget, vs prior months | Building vs building, region vs region, portfolio-wide trends |
| Context | Building president perspective | CEO / COO / VP perspective with strategic framing |
| Research | Web search for regulations and clinical info | Web research: M&A, competitive intel, market analysis, regulatory landscape |
| Escalation | Escalation to Will or Owen | Escalation chain and cross-building coordination through shared data |
| Document generation | Building-level reports and letters | Board decks, investor updates, portfolio summaries, pro formas |
| Data upload | Not available | Upload spreadsheets, PDFs, documents for analysis |
When you ask the Executive Portal about a specific building, it pulls the exact same Fabric and Vena data that building's own agent uses. The difference is that you can compare it to every other building in the same question. "How does Boise's EBITDAR compare to Shaw Mountain?" -- something a building agent cannot answer.
Part I -- Chapter 01What the Executive Portal Is
The Executive Portal is your fleet-wide intelligence layer. It sits above all the building agents and has access to every building's financial data simultaneously. Think of it as having 48 building analysts reporting to you in one chat window.
What it knows
- Every building's financials -- revenue, expenses, EBITDAR, margins, PPD, census for every facility in the portfolio
- Historical data -- Vena P&L data back to 2019. Last 24 months actively indexed for each building
- Live data -- Fabric real-time feeds for current-month wages, revenue, and census
- Payor mix -- Medicare, Medicaid, Managed Care, Private Pay breakdowns by building
- Budget targets -- building-level and portfolio-level budgets for comparison
- Chart of accounts -- GL-level detail for any expense or revenue category
What you can do with it
- Portfolio snapshots: "Show me EBITDAR for all buildings last month"
- Cross-building comparison: "Compare Boise, Shaw Mountain, and Cedar Valley on wage PPD"
- Trend analysis: "Which buildings have declining margins over the last 6 months?"
- Web research: "Research the competitive landscape for SNFs in the Boise market"
- Strategic documents: "Draft a board summary of Q2 portfolio performance"
- Pro forma modeling: "Build a pro forma for a 120-bed SNF in Phoenix at 85% occupancy"
Part I -- Chapter 02The Interface
The Executive Portal uses a single full-width chat layout -- different from the facility portal's split-panel design. The conversation flows top to bottom with agent responses and artifact cards inline. Additional tools appear in the header, and a light theme is available by default.
Unlike the facility portal's split-panel output, the executive portal delivers results inline in the conversation. When the agent generates a dashboard, chart, or report, it appears as an artifact card directly in the chat stream. Click "Fullscreen" to view the full interactive dashboard in an overlay, or "Download" to save it.
This means your entire workflow stays in one scrollable thread -- questions, answers, and data visualizations all together.
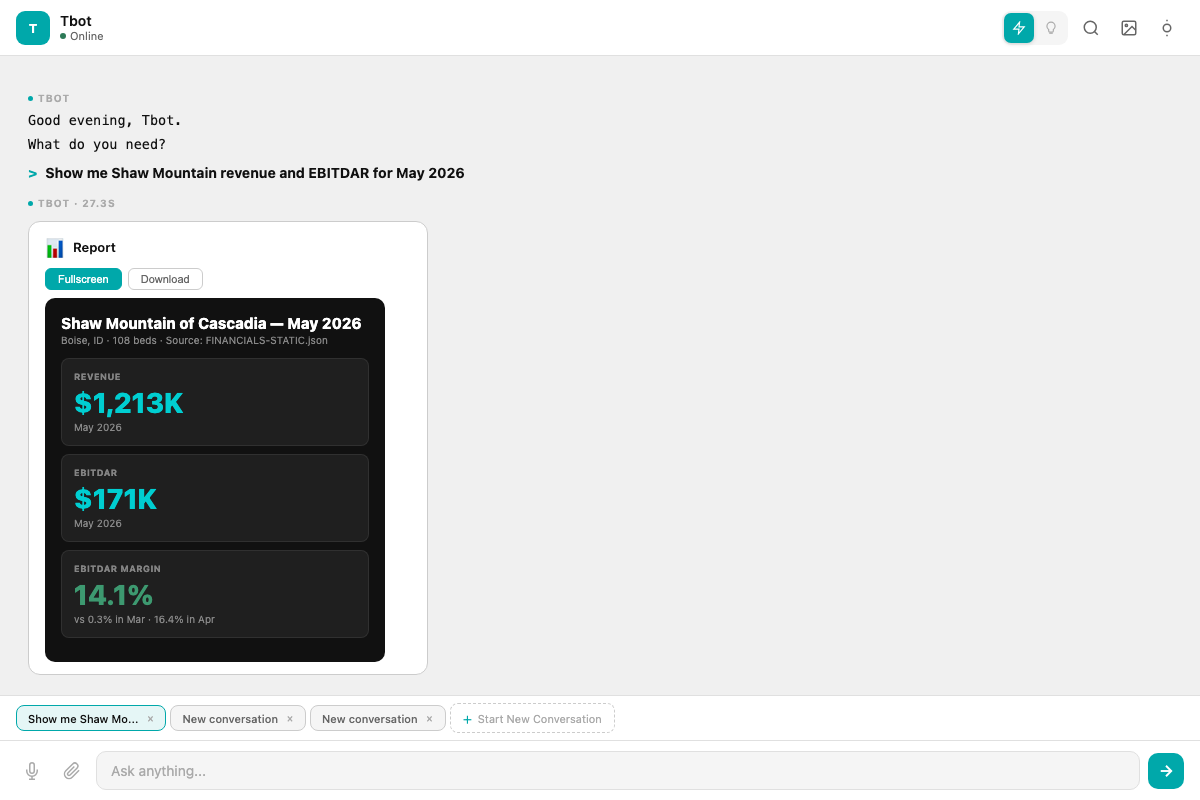
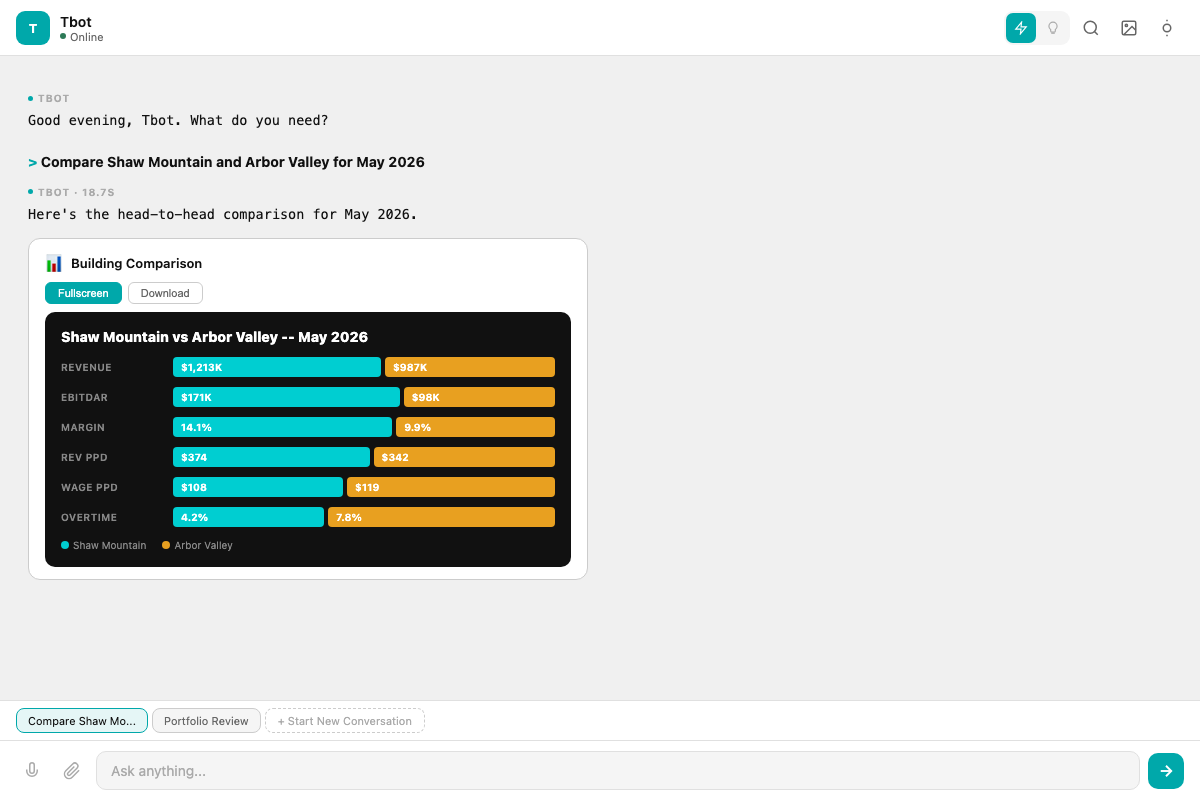
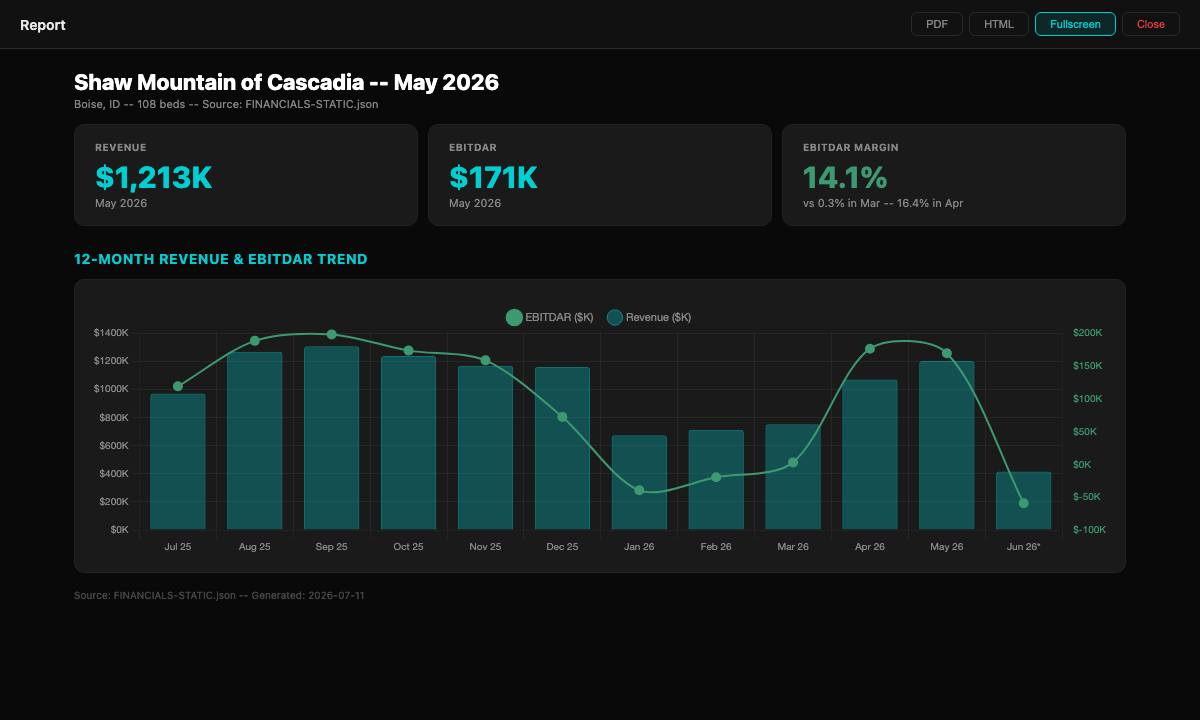
Try the interactive demo below:
What's different in the executive interface
| Feature | Facility Portal | Executive Portal |
|---|---|---|
| Default model | Speed (Sonnet) | Quality (Opus) -- defaults to deep analysis mode |
| Search icon | Not shown | Web search tool in header |
| Layout | Split panel (chat + output) | Single full-width chat with inline artifact cards |
| Color scheme | Dark with crimson accent | Dark with teal accent (light theme toggle available) |
| Agent avatar | Crimson with building initial | Teal rounded square with agent initial |
| Message style | Chat bubbles | Uppercase agent label, monospace text, ">" prefix for user |
| Conversation tabs | Basic history | Named session tabs at bottom with "+ New Conversation" |
InteractiveAsk Me Anything Simulator
Type any fleet-level question below. The simulator uses pattern matching to demonstrate the range of questions your executive portal can handle -- from portfolio performance to competitive intelligence to board-ready reporting.
Part I -- Chapter 03Model Selection
The Executive Portal defaults to Quality mode (Opus) because executive questions tend to be complex -- cross-building comparisons, strategic analysis, document generation. You can switch to Speed (Sonnet) for quick lookups.
| Icon | Mode | Model | Best For (Executive) |
|---|---|---|---|
| Lightning bolt | Speed | Claude Sonnet 4.6 | "What's Boise's census?" / "Show me Shaw Mountain revenue" / quick single-building lookups |
| Lightbulb | Quality | Claude Opus 4.6 | Cross-building analysis, strategic recommendations, board documents, pro formas, research synthesis |
Executive questions often require the agent to compare multiple buildings, identify patterns, and frame findings strategically. Opus handles this significantly better than Sonnet. Only switch to Speed when you need a simple, single-building data point and don't want to wait 15-30 seconds.
Part I -- Chapter 03bThe Tools Menu
The facility portals include a Tools menu (waffle icon) with specialized applications. These tools are rolling out across the fleet -- here is what is live and what is coming soon. The executive portal will gain access to these tools in a future update.
Portfolio-level tools like Financial Forecast and Contract Review are designed with fleet-wide analysis in mind. When they launch, executives will be able to run projections and audits across all buildings from a single portal.
Part II -- Chapter 04Fleet-Wide Financial Queries
This is the core power of the Executive Portal. You can query any building, any combination of buildings, or the entire portfolio in a single question.
Portfolio-level questions
- "Show me EBITDAR for all buildings last month"
- "What's the portfolio revenue PPD?"
- "Which buildings are above budget and which are below?"
- "Rank all buildings by margin percentage"
- "What's total fleet revenue for Q2?"
- "Show me the top 5 and bottom 5 by EBITDAR"
Single-building deep dive
- "Show me Shaw Mountain's full P&L for May"
- "What's Boise's overtime trend for the last 6 months?"
- "Break down Cedar Valley's expenses by GL category"
- "What's Summit View's payor mix?"
The agent handles multi-scope queries naturally: "Compare Boise and Shaw Mountain EBITDAR for the last 3 months, then show me the portfolio average." It will pull data for both buildings AND the fleet average in one response.
Part II -- Chapter 04bWhat-If Calculator
Adjust census and payor mix to see how changes affect your bottom line. All calculations use real portfolio data.
Part II -- Chapter 05Cross-Building Analysis
The most powerful feature of the Executive Portal is comparing buildings side by side. Every metric can be compared across any combination of facilities.
Comparison frameworks
| Type | Example Question | What You Get |
|---|---|---|
| Head-to-head | "Compare Boise vs Shaw Mountain on all metrics" | Side-by-side comparison table with revenue, expense, margin, census, PPD for both buildings |
| Rank | "Rank all buildings by wage PPD, lowest to highest" | Ordered list showing which buildings are most efficient and which need attention |
| Outlier detection | "Which buildings have OT above 8%?" | Filtered list of buildings exceeding the threshold with detail on why |
| Trend comparison | "Show margin trends for all buildings over 6 months" | Multi-line trend showing which buildings are improving, declining, or stable |
| Variance | "Which buildings missed budget last month and by how much?" | Variance analysis showing budget vs actual for each building |
When comparing buildings of different sizes, the agent automatically uses PPD (Per Patient Day) metrics instead of raw dollar amounts. A 200-bed building will naturally have higher total revenue than a 60-bed building, but PPD puts them on equal footing. If you want to see raw dollars, just ask: "Show me that in whole dollars."
Part II -- Chapter 05bPortfolio Health Dashboard
Real-time health indicators across the portfolio. Green means on-target, yellow is watch, red needs action.
Part II -- Chapter 06The Data Pipeline
Understanding where the data comes from helps you ask better questions and trust the answers.
How data flows
Data freshness
| Data Type | Source | Updated | Lag |
|---|---|---|---|
| Wages (current month) | Fabric | Each payroll cycle | 1-3 days |
| Revenue (current month) | Fabric | As claims process | 1-5 days |
| Census | Fabric | Daily | 1 day |
| P&L (closed months) | Vena | After month close | 10-15 days after month end |
| FINANCIALS-STATIC rebuild | Pipeline | 3 AM nightly | <24 hours |
Part III -- Chapter 07Web Research
The Executive Portal can search the internet for current information and synthesize it into actionable intelligence. This is Quality mode territory -- complex questions that require reading multiple sources.
Research capabilities
- "Research the current status of the CMS minimum staffing mandate"
- "What SNF acquisitions have happened in the Pacific Northwest in the last 12 months?"
- "Summarize the latest Medicare reimbursement changes affecting SNFs"
- "Research the competitive landscape for skilled nursing in Boise, Idaho"
- "What are the current Medicaid rates in Idaho vs Washington for SNFs?"
- "Find the latest Five-Star ratings for our competitors in the Boise market"
When the agent searches the web, it reads multiple sources, cross-references them, and synthesizes the findings. This takes longer than a data lookup. The agent will tell you what sources it used so you can verify anything critical.
InteractiveSpeed Challenge -- Fleet Intelligence
How fast can you get a fleet-wide answer? Hit START, read the question, type anything into the input, and send. The timer shows how quickly the portal would respond.
Part III -- Chapter 08Document Generation
The Executive Portal can generate publication-ready documents using your actual portfolio data.
Document types
| Document | How to Ask | What You Get |
|---|---|---|
| Board summary | "Draft a board summary of May portfolio performance" | Executive summary with KPIs, trends, highlights, and risks -- ready to present |
| Investor update | "Create a quarterly investor update for Q2" | Professional narrative with financial highlights, growth metrics, and outlook |
| Building analysis | "Write a performance analysis for Shaw Mountain" | Deep-dive on a single building with recommendations |
| Pro forma | "Build a pro forma for a 120-bed SNF acquisition in Phoenix" | Financial model with revenue projections, expense assumptions, and ROI analysis |
| Comparison report | "Compare our portfolio metrics to industry benchmarks" | How Cascadia stacks up against national SNF averages |
Generated documents appear inline in the chat as artifact cards. Click "Open" to view the full formatted output, or "Download" to save it. You can also ask the agent to email it. For board-ready output, specify: "Format this for a board presentation."
Part IV -- Chapter 10Sessions and Context Management
The Executive Portal uses named conversation tabs at the bottom of the screen. Each tab is a separate session with its own context.
Session management
| Action | How | Best For |
|---|---|---|
| Start new | Click "+ Start New Conversation" | Fresh analysis, new topic, clean context |
| Switch sessions | Click a conversation tab at the bottom | Jumping between ongoing analysis threads |
| Name a session | Sessions auto-name from the first question | Finding past work: "Q2 Board Prep," "Boise Deep Dive" |
Board prep in one session. Building performance reviews in another. Market research in a third. This prevents context bleed and keeps each analysis focused. The agent handles each session independently.
Long sessions (40+ messages) get automatically compressed -- the agent summarizes older exchanges to keep things fast. If a session starts feeling slow or the agent seems to lose context, start a new one.
InteractiveStrategic Decision Simulator
Walk through a real strategic scenario step by step. See how executives use the portal to evaluate an acquisition opportunity -- from market research through board-ready output.
Scenario: 150-Bed Facility Acquisition in Oregon
Your board wants to evaluate acquiring a new skilled nursing facility. Walk through the four steps an executive would take using the portal.
What just took 4 clicks in this demo would have previously required your team to compile market research, build a financial model in Excel, cross-reference your own portfolio data, and draft a memo -- typically 2-3 weeks of work. The executive portal compresses that into a single conversation.
Part IV -- Chapter 11Troubleshooting
| Problem | Cause | Fix |
|---|---|---|
| Portal won't load | Server offline or tunnel issue | Check your internet connection. If it persists, contact Owen or the tech team. Executive portals run through Cloudflare tunnels which occasionally need restart. |
| "Data for [building] not available" | That building's data hasn't been pushed yet or the building isn't in the portfolio data file | The nightly pipeline pushes data at 3 AM. If a building was recently added, it may take 24 hours to appear. Escalate to Owen if it persists. |
| Cross-building comparison seems wrong | Mismatched time periods or one building has Fabric estimates while another has Vena closed data | Ask: "What data source is being used for each building?" The agent will clarify. Wait for month close for apples-to-apples comparison. |
| Research returns nothing | Very specific query or web search throttling | Rephrase the question more broadly. "CMS SNF staffing rules 2026" works better than a very narrow query. |
| Agent seems slow | Quality mode + complex multi-building query | Normal. Fleet-wide analysis in Quality mode can take 20-45 seconds. Switch to Speed for quick lookups. |
Part IV -- Chapter 12Tips and Best Practices
Executive-level questioning
| Good | Better | Best |
|---|---|---|
| "How are we doing?" | "Show me EBITDAR for all buildings last month" | "Rank buildings by EBITDAR margin, flag any below 7%, and show the 3-month trend for the bottom 3" |
| "Tell me about Boise" | "Show me Boise's full P&L for May" | "Compare Boise May vs April, highlight the biggest changes, and show PPD trends for the categories that moved most" |
| "Any problems?" | "Which buildings have OT above target?" | "Show me OT % by building, flag any above 8%, break down the worst one by department, and estimate the dollar impact if we brought them to target" |
Power moves
- Chain requests: "Show me the bottom 3 buildings by margin, then for each one tell me the top 3 cost categories driving it"
- Paste documents: Copy a competitor's press release or an acquisition listing into the chat and ask "analyze this"
- Historical analysis: "Compare Q2 2026 to Q2 2025 across the portfolio" -- the agent has 24 months actively indexed, with historical data back to 2019 on file
- Scenario modeling: "What would our portfolio margin look like if we brought every building's OT to 5%?"
- Export ready: "Format that as a one-page executive summary I can email to the board"
Part IV -- Chapter 12bYour Monday Morning Routine
Here's how the most effective executives use the portal to start their week.
This three-step routine takes less than three minutes. No spreadsheets, no waiting for reports, no email chains. You walk into your Monday meeting with a complete picture of portfolio performance and a focused agenda.
Knowledge ChecksTest What You Learned
Part V -- Chapter 13Advanced Analytics Demo
Financial queries are just the beginning. The Executive Portal is a full-stack business intelligence platform. It builds dashboards, analyzes contracts, reviews invoices, processes uploaded data, creates ROI models, and generates investor-ready documents -- all from the same chat interface.
Everything shown below is a working demonstration of what the portal can produce. In production, the AI generates these outputs dynamically based on your actual data and requests. The portal does not just answer questions -- it builds tools.
Part V -- Chapter 14Document & Data Processing
The portal processes a wide range of business documents and data formats. Upload a file, paste content, or describe what you need -- the AI handles extraction, analysis, and formatting.
The portal accepts spreadsheets (.xlsx, .csv), PDFs, Word documents, images, and plain text. Paste content directly into the chat or describe what you need analyzed. The AI adapts its processing based on the content type and your request.
Part V -- Chapter 16Real-Time Research
The Executive Portal connects to live information sources to deliver current, cited research on any topic relevant to your business. Every finding comes with source attribution and confidence indicators.
← Back to Training Home | ← Facility Portal Guide
JockiBox -- Horizon Healthcare | July 2026