One AI analyst per building. Connected to your financials, census, payor mix, and every facility in the portfolio. Ask a question, get a data-backed answer in seconds.
Audience: Prospective ClientsInteractive: Live demos throughoutVersion: July 2026
JockiBox puts a private AI analyst inside your building. It connects to your financial data, your census, your payor mix -- and every other building in the portfolio. Ask a question in plain English, get a data-backed answer in seconds. No spreadsheets. No waiting for reports. No guessing.
JockiBox Portal
You:
Section 01By the Numbers
48
Buildings
Across multiple states
24
Months Indexed
Data back to 2019 on file
Seconds
Not Hours
Question to data-backed answer
100%
Private
Data never leaves your building
Every building connected. Every answer instant.
Data flows between HQ and every facility in the portfolio in real time.
Section 02The Difference
Every skilled nursing operator knows the pain: scattered data, delayed reports, and decisions made on gut feel instead of real numbers. JockiBox changes that.
WITHOUT JOCKIBOX
Spreadsheet digging
Hours spent finding last month's numbers across multiple files.
Waiting for reports
Requesting data from accounting, waiting days for a formatted response.
Delayed decisions
Problems show up weeks later when they have already cost you money.
WITH JOCKIBOX
Ask in plain English
"What was our EBITDAR last month?" -- answered with real data in seconds.
Live dashboards
KPI cards, charts, and reports generated instantly in the output panel.
Real-time data
Connected to payroll, billing, and census feeds. Always current.
Section 03What Your Portal Can Do
Every JockiBox portal has access to every building in the portfolio. Here are the eight core capabilities.
Financial Intelligence
Revenue, EBITDAR, P&L, GL-level detail -- from your building or any building in the fleet.
Census & Payor Mix
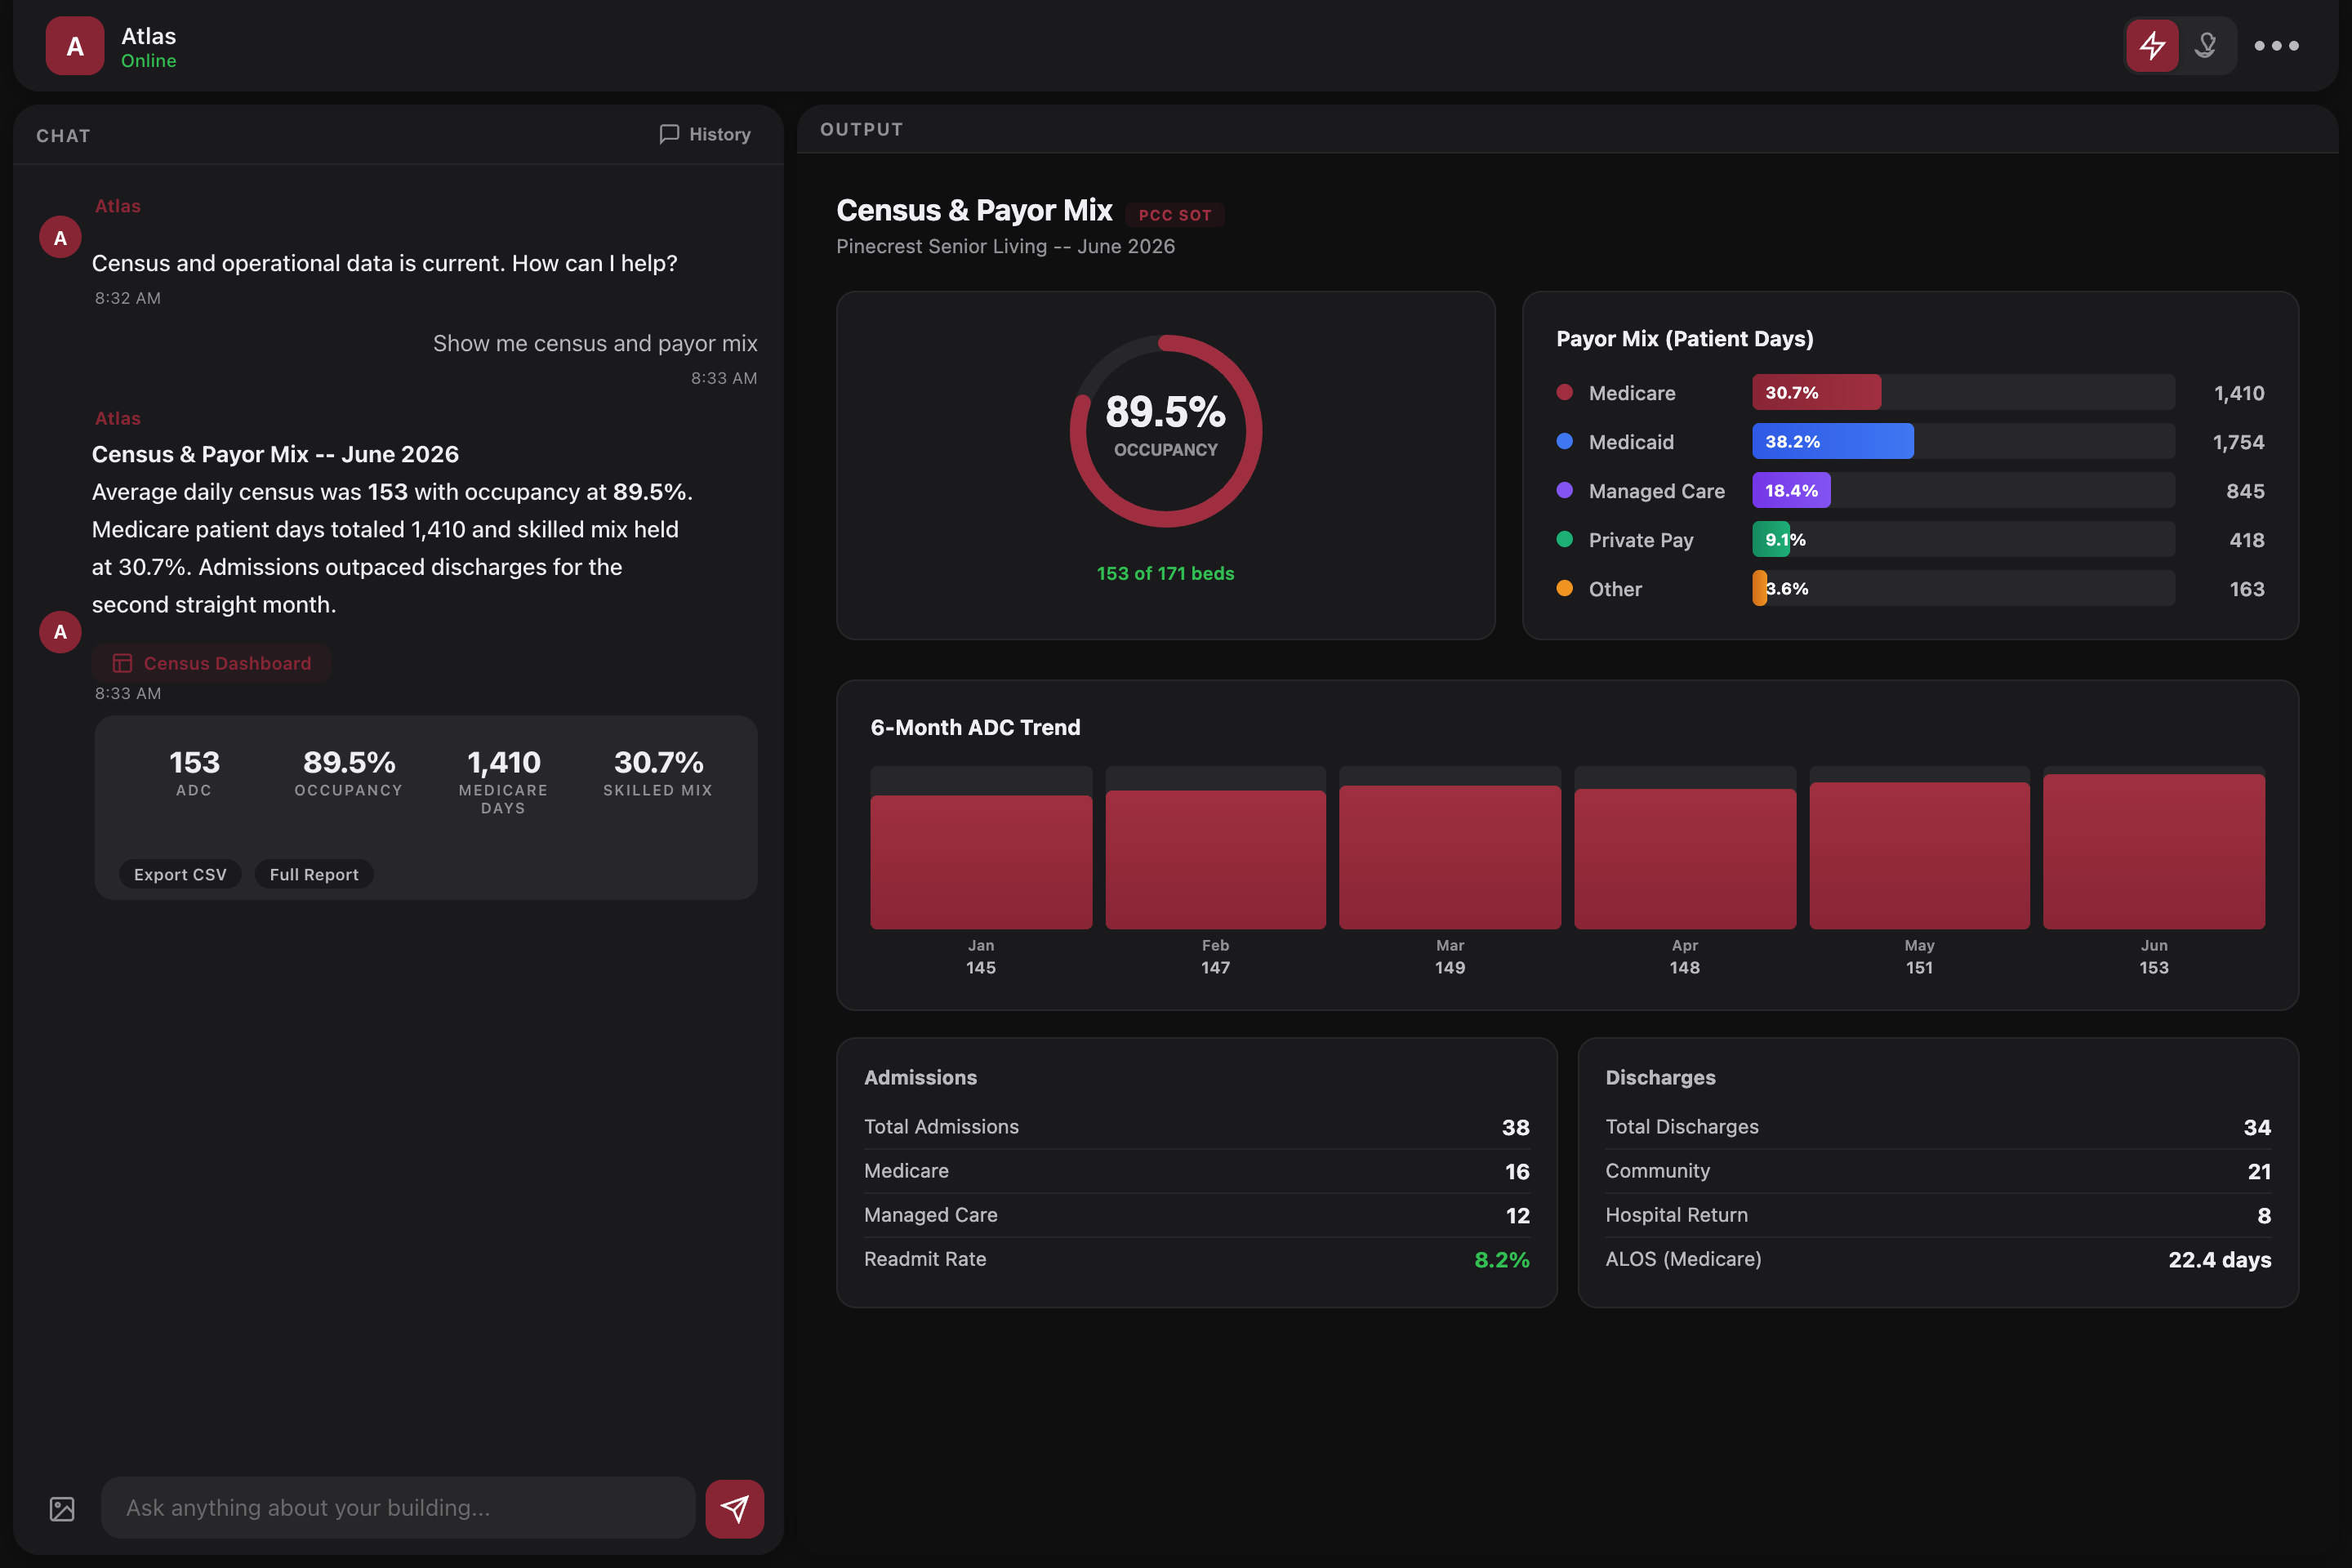
Real-time ADC, patient days, payer breakdown by Medicare, Medicaid, Managed Care, Private.
Overtime Monitoring
Department-level OT tracking against your target. Nursing, Housekeeping, Dietary -- all visible.
Clinical Guidance
CMS regulations, F-tags, state rules, staffing requirements -- searched and synthesized.
Smart Reporting
Board-ready reports and financial summaries generated on demand. Export or email.
Dual AI Modes
Speed mode for quick lookups. Quality mode for deep analysis. One-click toggle.
Cross-Building Compare
Compare any building to any other. Rank the fleet. Spot outliers. Same data everywhere.
Data Transparency
Every number shows its source: Fabric Live (real-time) or Vena SOT (closed official).
Section 03bSee It In Action
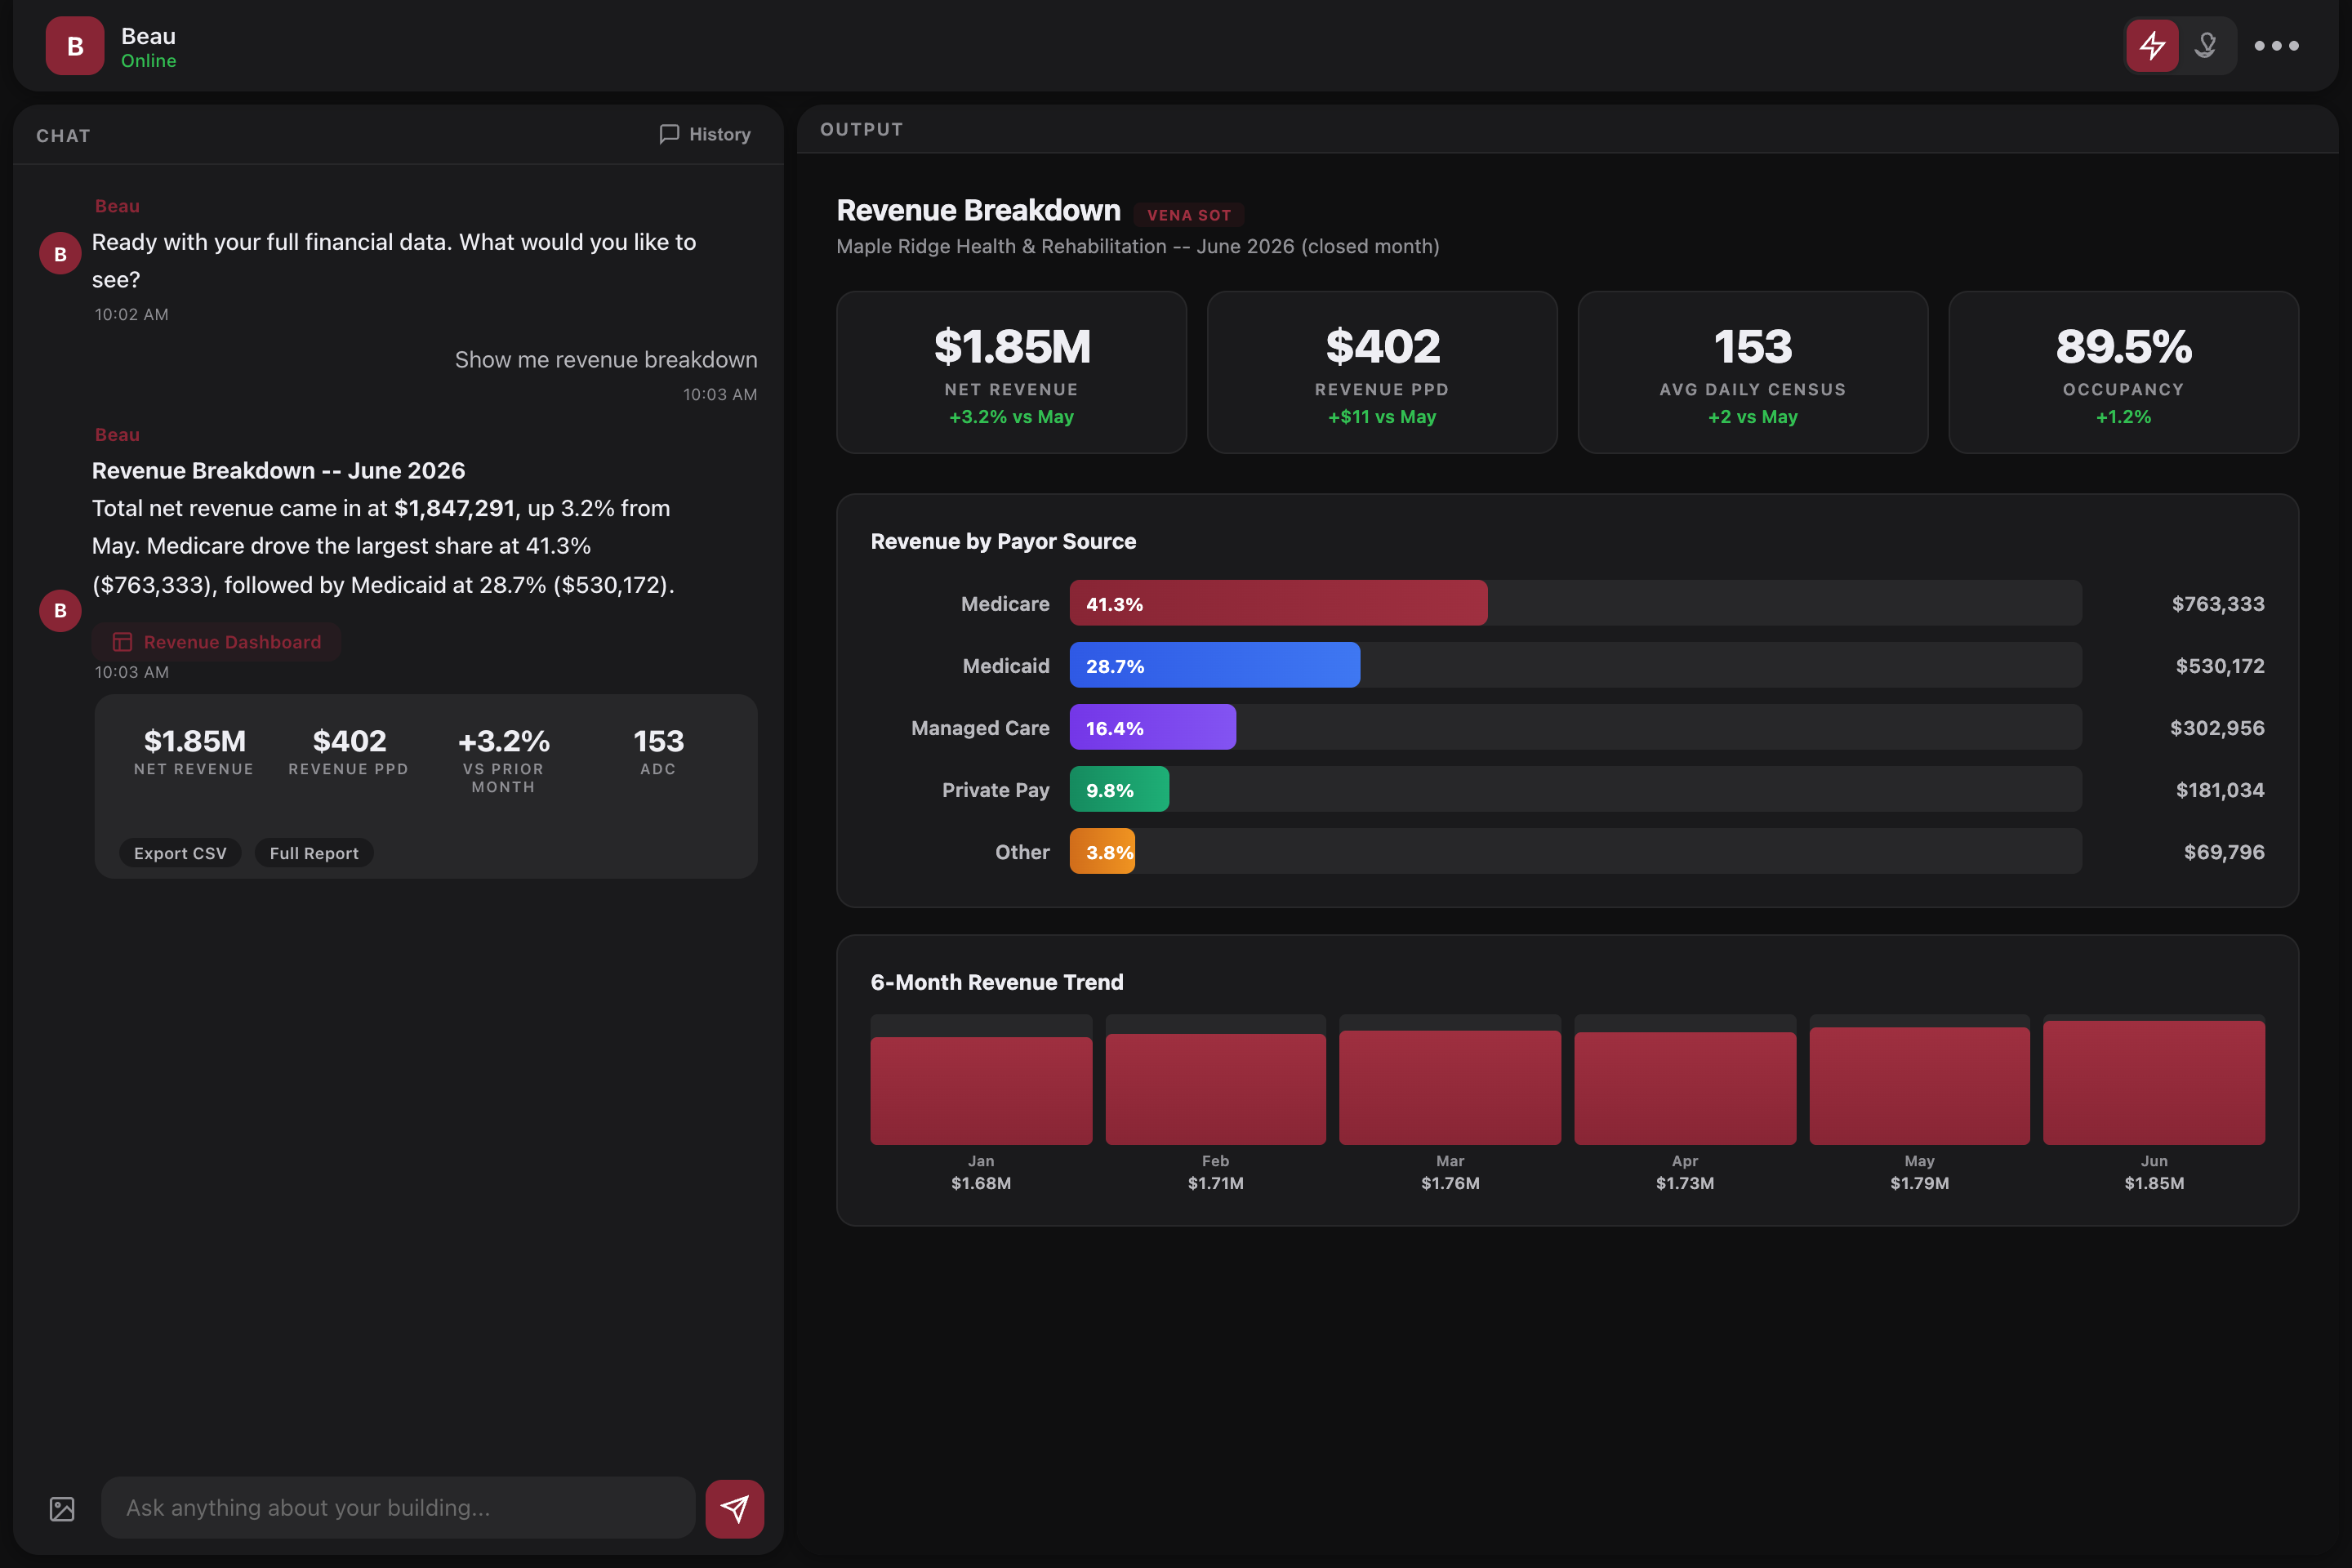
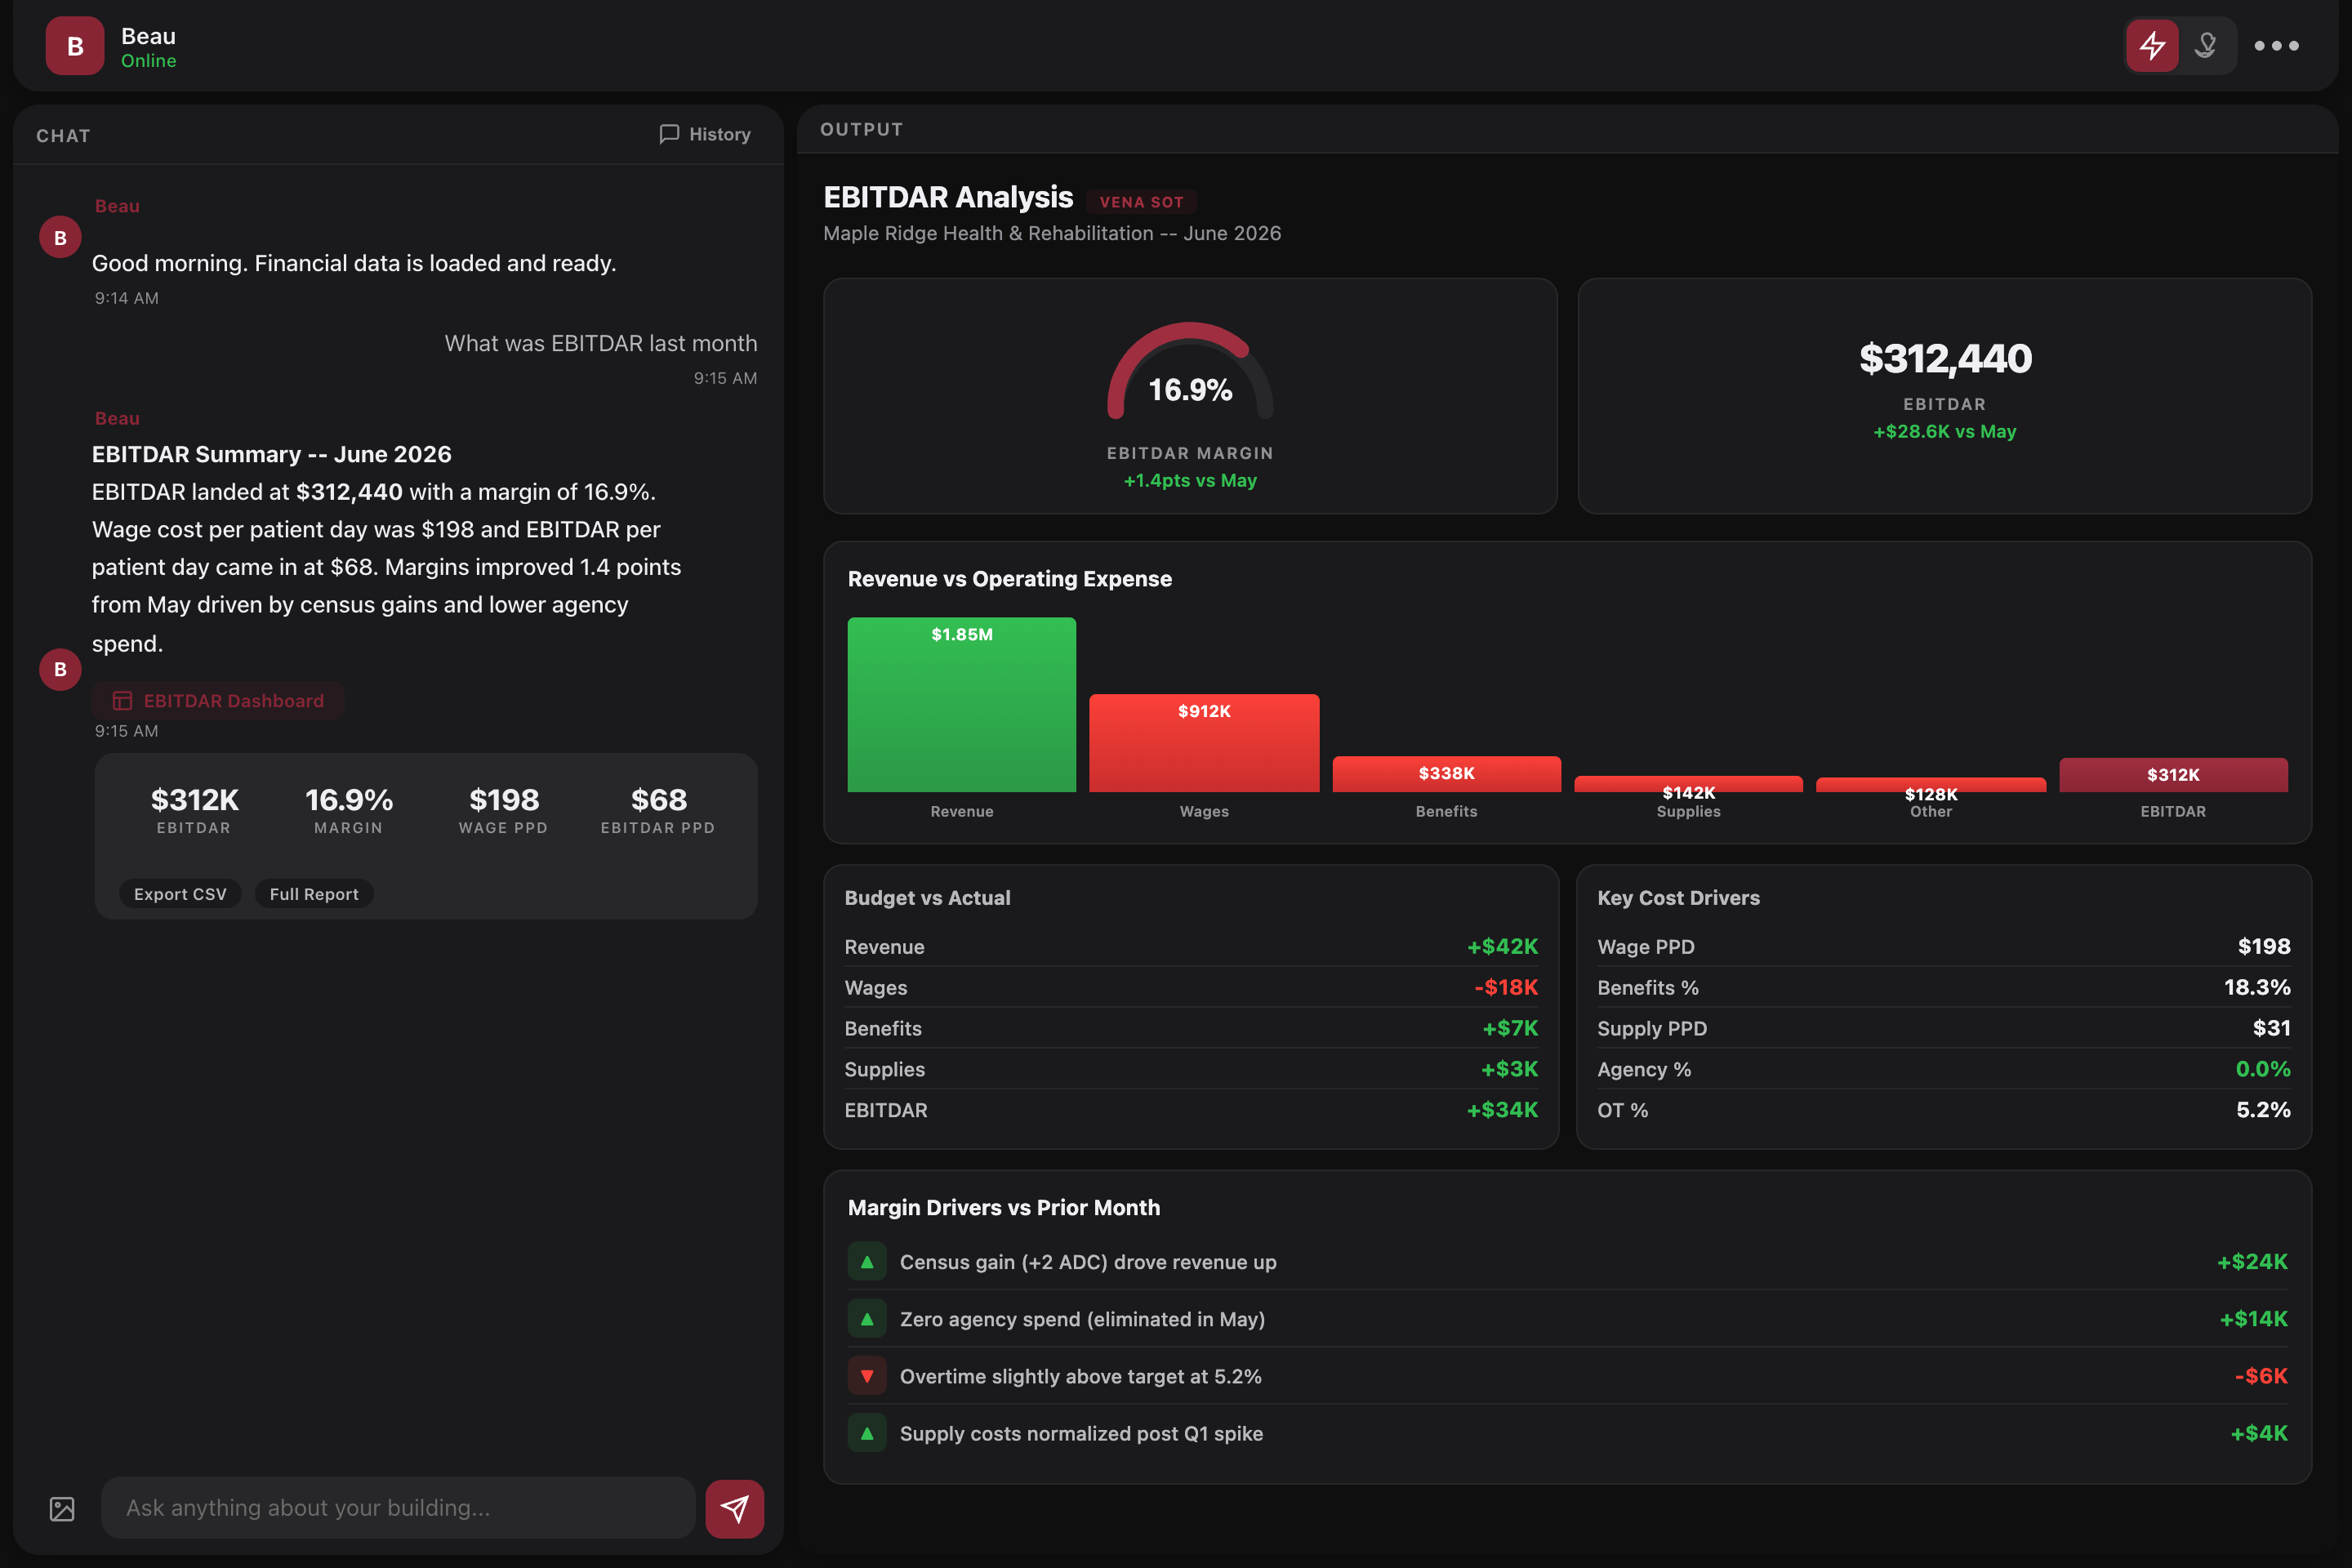
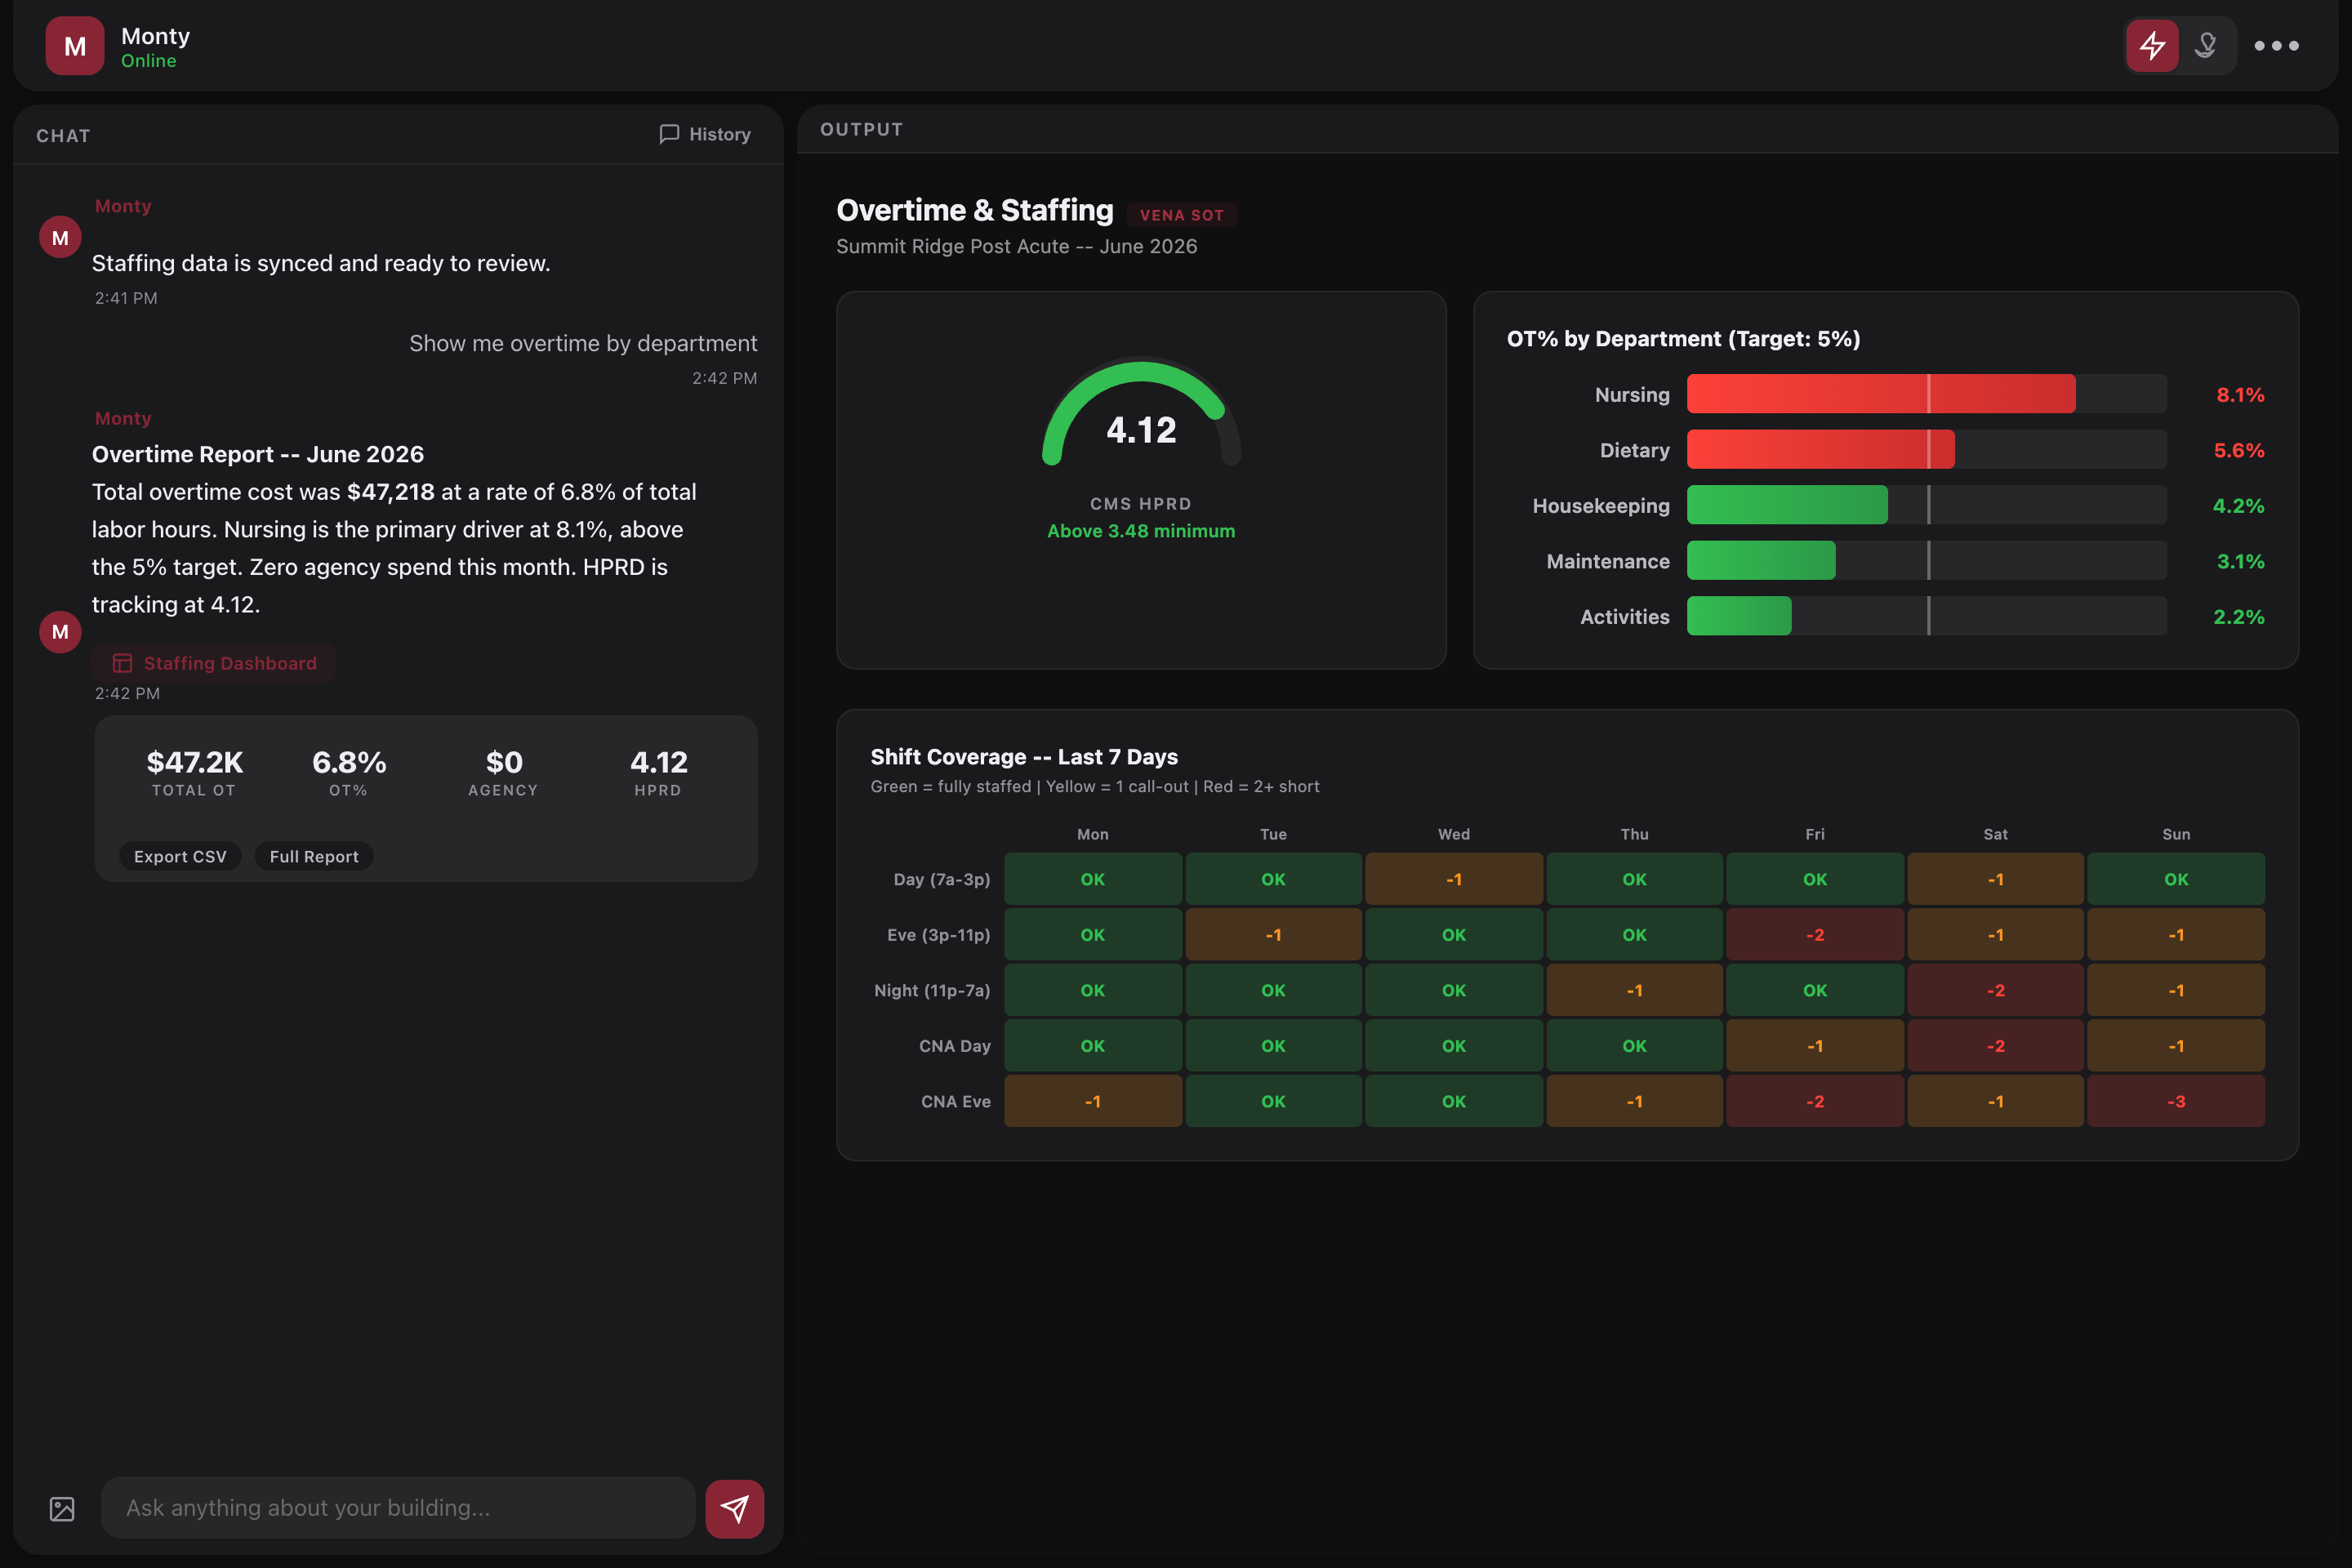
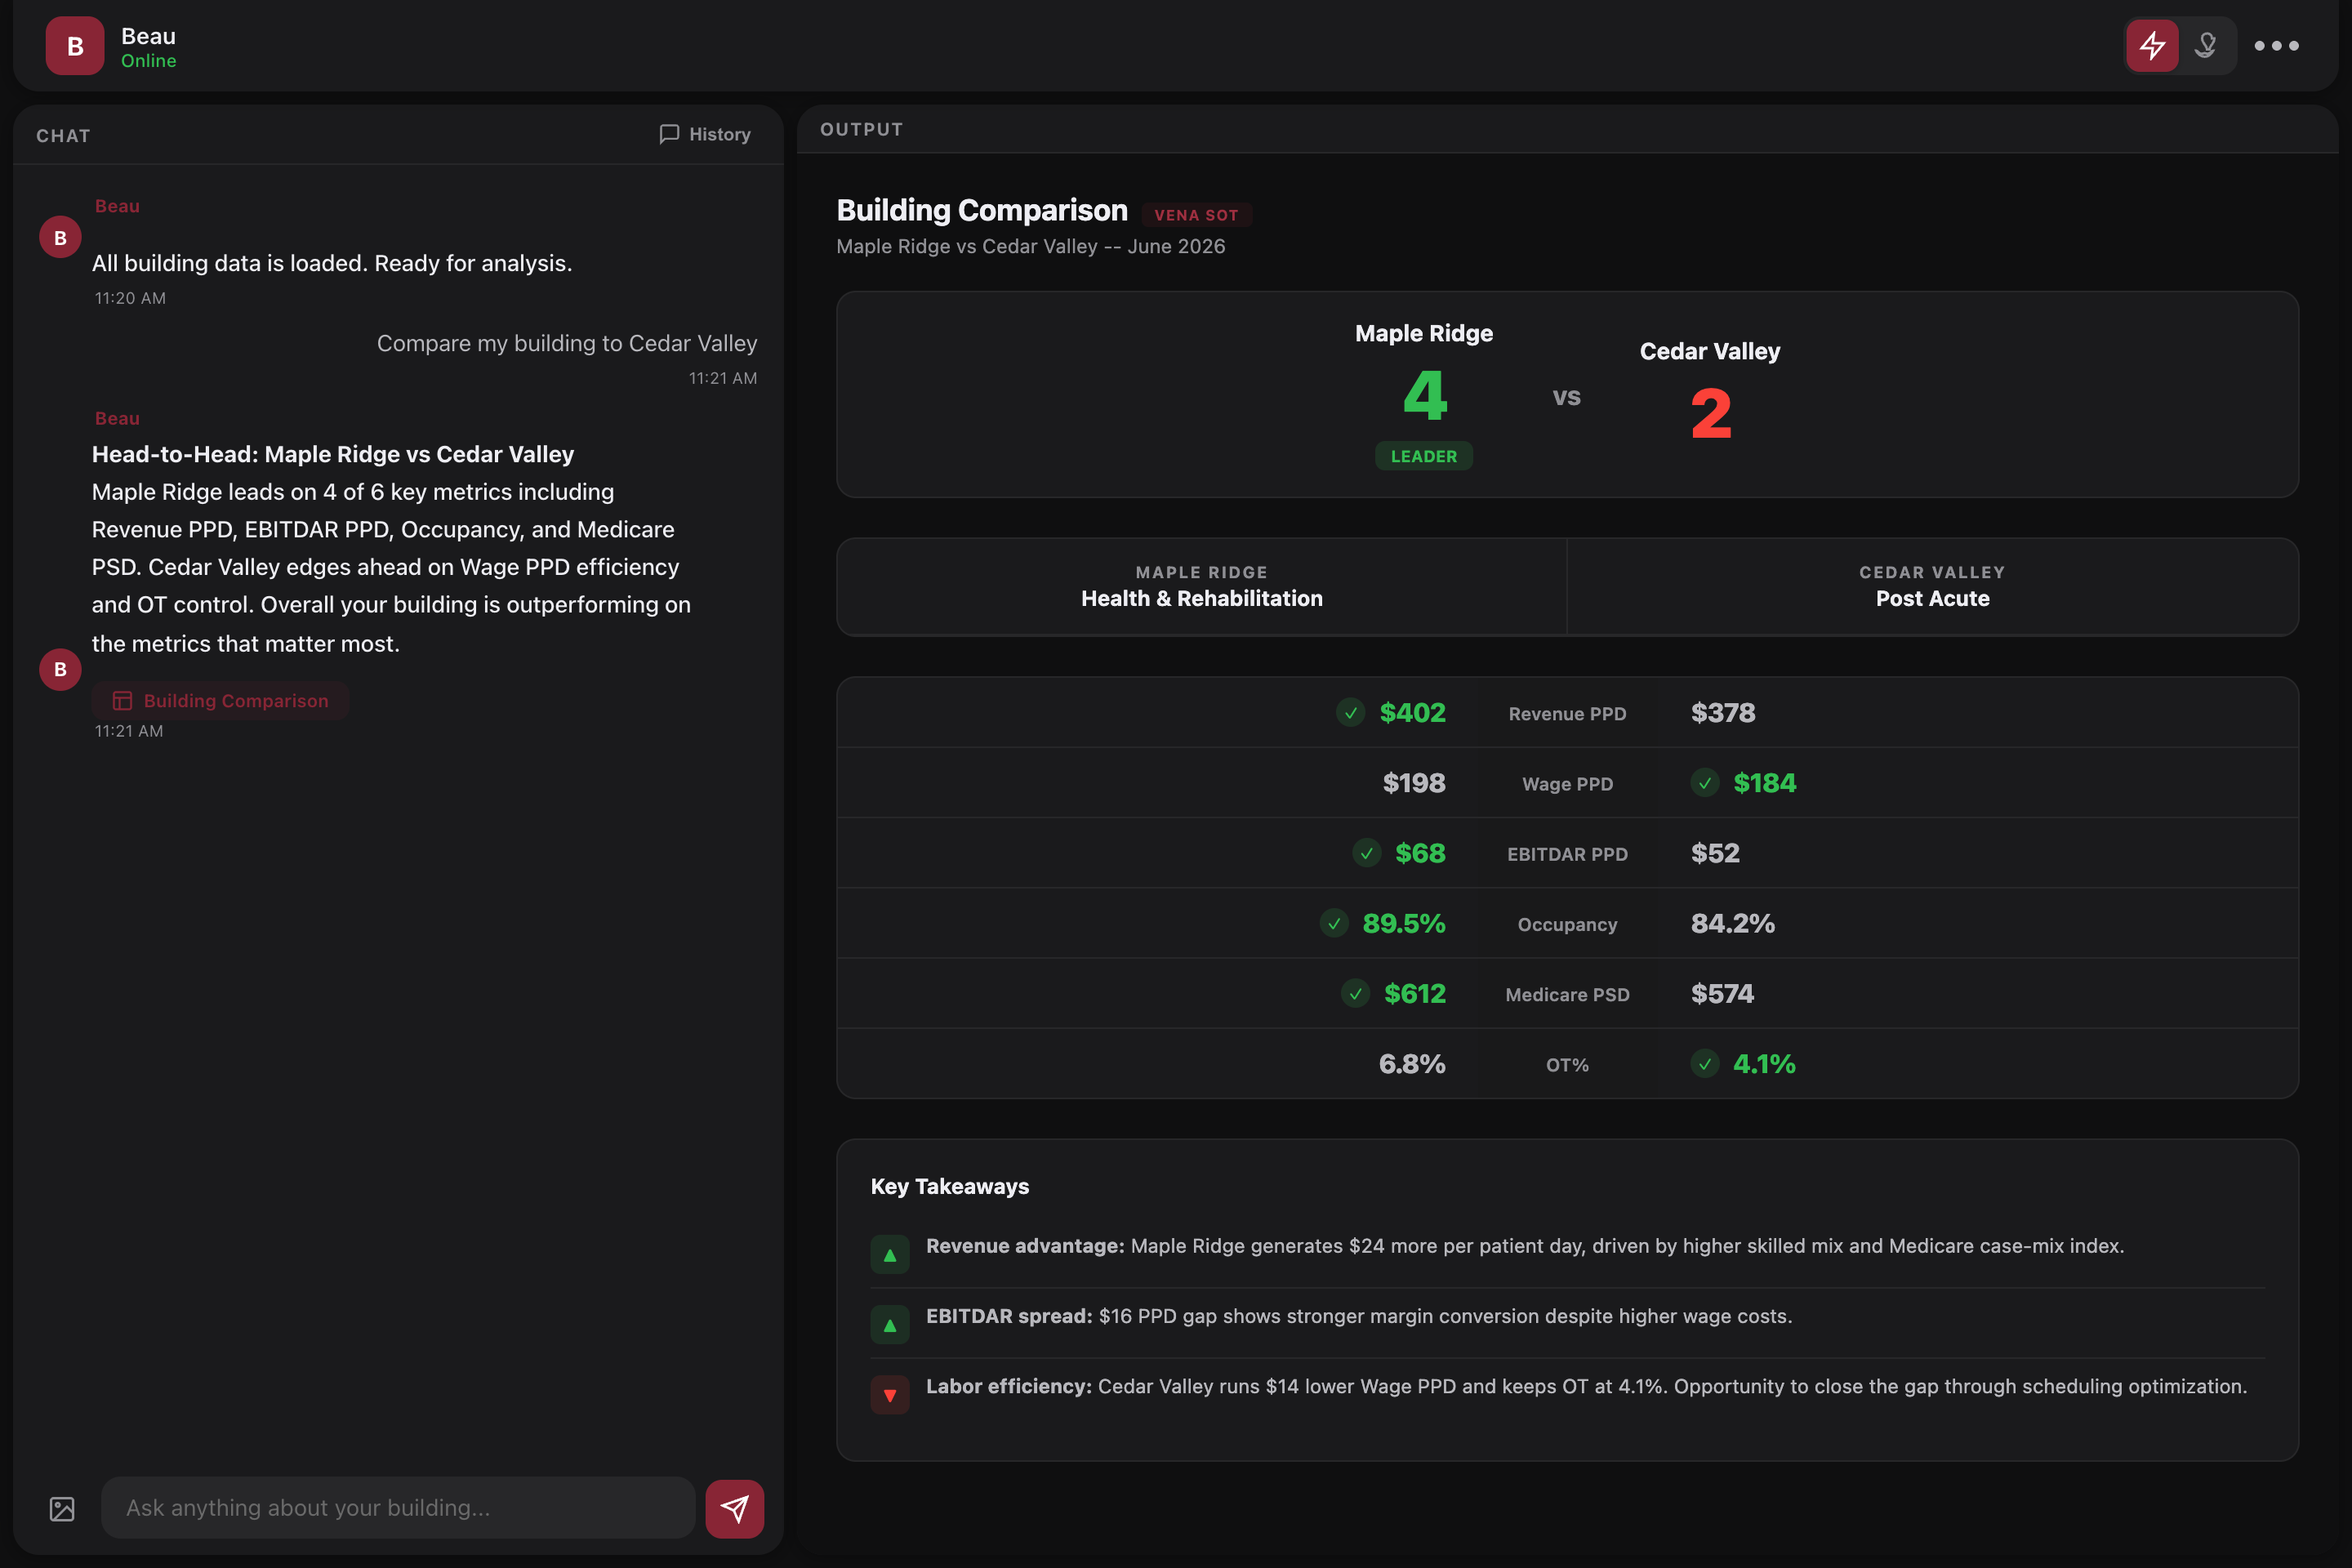
These are real portal screenshots showing actual financial dashboards, clinical scorecards, and operational views. This is exactly what your team sees every day.
Revenue Breakdown -- See exactly where your money comes from and spot payor mix shifts before they impact margin.
EBITDAR Analysis -- Know your true operating margin with budget variance and cost waterfall in one view.
Overtime Monitoring -- Catch department-level OT spikes before they cost you thousands.
Building Comparison -- See how you stack up against every facility in the portfolio, metric by metric.
Census & Payor Mix -- Track occupancy trends and payor shifts that drive your revenue mix.
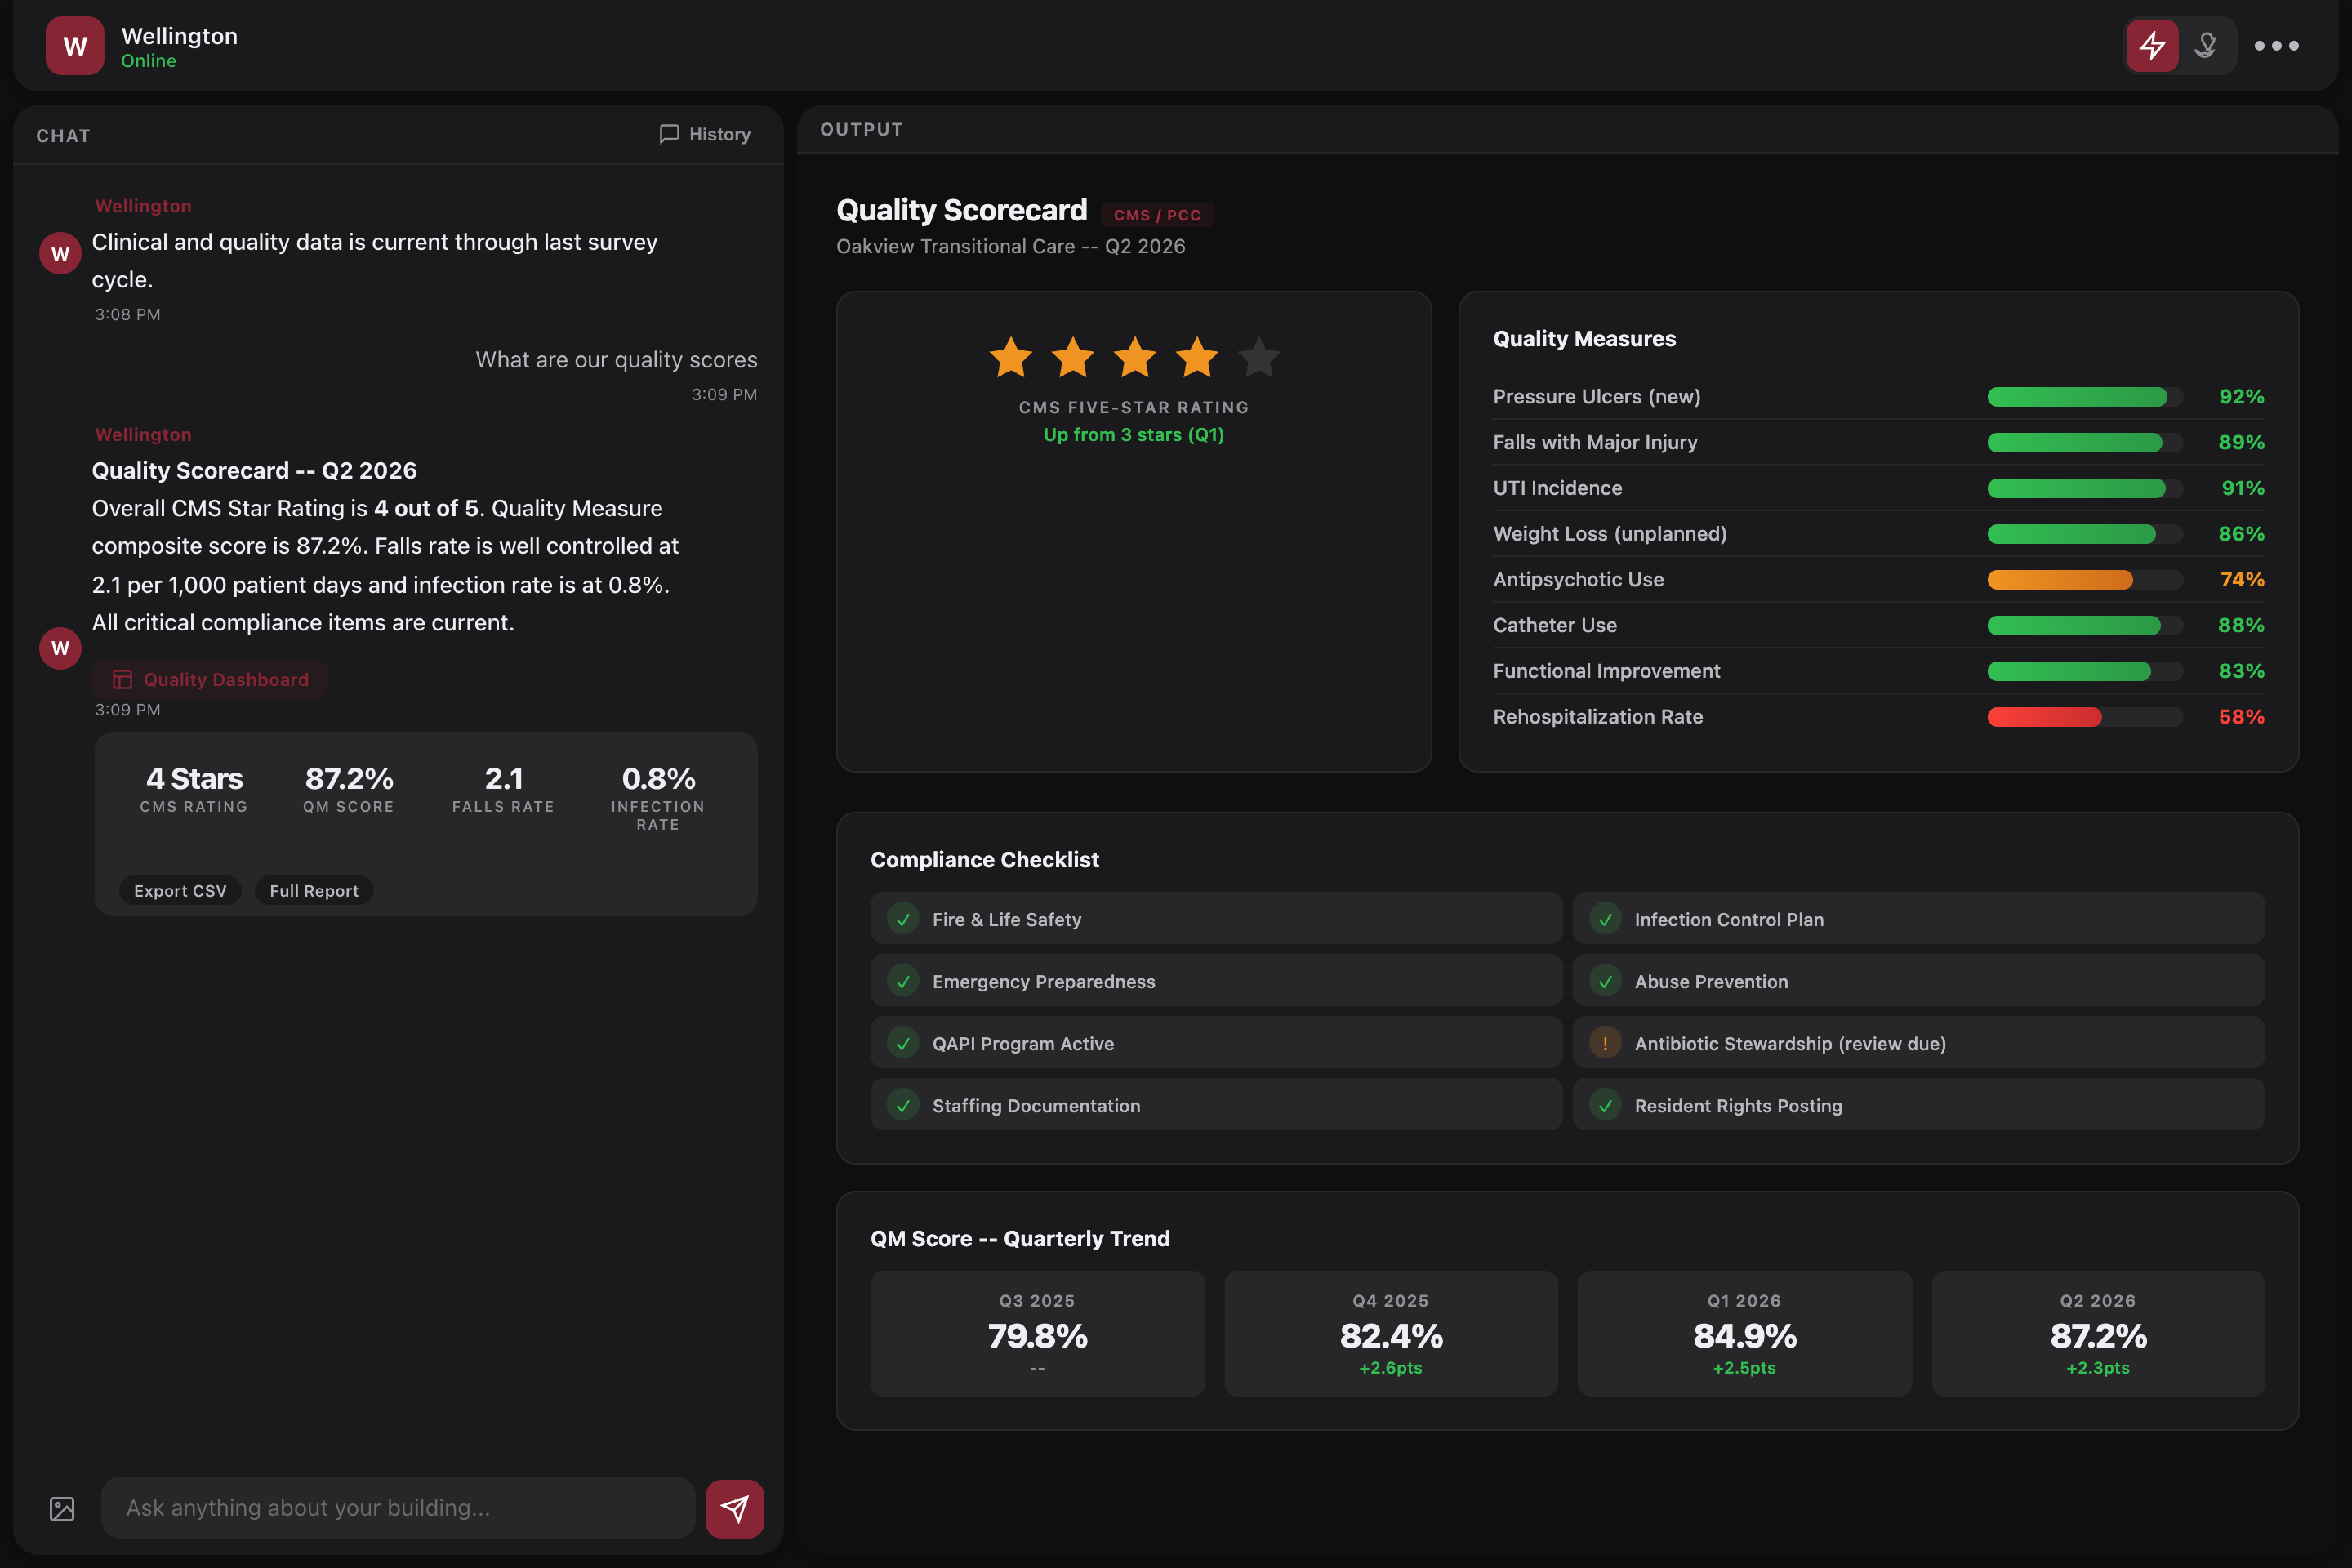
Quality Scorecard -- CMS five-star ratings, QM scores, and compliance status at a glance.
De-identified data
These screenshots use de-identified facility data. In your live portal, these dashboards pull from your actual Fabric and Vena data feeds.
Financial Intelligence Demo
Ask about revenue, EBITDAR, P&L, payor mix, or any financial metric. The portal pulls your actual data and presents it with context. Try it below.
Financial Portal Demo
interactive
J
JockiBox Demo
online
Chat
JockiBox
I have your building's full financial data plus every other building in the portfolio. Ask me anything.
Last query: --Try: "compare to last year" or "same thing for Cedar Valley"
Output
This demo uses de-identified facility data. In your live portal, these numbers come from your actual Fabric and Vena data feeds.
Section 05How It Works
From zero to operational intelligence in 24 hours.
We Install
A dedicated Mac Mini is placed in your building. Plug in, connect to network.
Data Connects
Payroll, billing, and census feeds connect automatically. Data flows nightly.
AI Loads
Your private AI analyst loads your building's data -- financials, census, history.
Ask Anything
Open in any browser. Ask a question. Get a data-backed answer in seconds.
Section 07What-If Calculator
Adjust census and payor mix to see how changes affect your bottom line. All calculations use real facility data.
What-If Scenario Builder
interactive
Section 08Security & Privacy
Your data never leaves your building.
On-premise hardware -- physically in your building
No cloud dependency for core operations
Private AI model -- your data is never used for training
HIPAA-aligned architecture
Encrypted data at rest and in transit
No patient health information exposed
The Tools Menu
The waffle icon (3x3 grid) in the top corner of your portal opens the Tools menu -- a growing library of specialized applications beyond the AI chat.
Getting Started
Your AI partner guide
LIVE
Alerts
Critical notifications
COMING SOON
Care Compass
Clinical navigation
COMING SOON
Financial Forecast + Spend Down
Revenue and spend projections
COMING SOON
Contract Review
Managed care and vendor audit
COMING SOON
PDPM Calculator
Medicare payment modeling
COMING SOON
Casemix Tool
Casemix index analysis
COMING SOON
Cost Report Tool
Annual cost report preparation
COMING SOON
Every JockiBox portal includes the full AI chat and the Getting Started guide. Additional tools launch throughout 2026 and are included for Cascadia buildings. For other organizations, tools are available as add-on modules.
Social ProofWhat Operators Are Saying
“
We went from spending 8 hours a week pulling reports to getting answers in seconds. The portal paid for itself in the first month.
Building President, 120-bed SNF
“
I can compare my building to every other facility in the portfolio without calling anyone. Game changer for monthly reviews.
Director of Operations, 200-bed facility
“
The overtime alerts alone saved us $40,000 in the first quarter. We caught problems before they hit the P&L.
Administrator, 90-bed SNF
Section 04Full Portal Demo
This is the full portal experience. Type any question -- financial, operational, clinical, cross-building -- and see the response. This is what your building gets.
Time to Answer
0.0s
Analyzing your data
Answered in 3.2 seconds
vs. 45 minutes pulling from spreadsheets
You asked:
Full JockiBox Portal Experience
interactive
J
JockiBox Portal
online
Chat History +
JockiBox
Welcome. I have full access to your building's financial, operational, and clinical data -- plus every other building in the Horizon Healthcare portfolio. Ask me anything, or try one of the suggestions below.
Last query: --Try: "compare to last year" or "same thing for Cedar Valley"
Output ⛶
Reports and dashboards appear here. Ask a question to see it in action.
This demo uses de-identified facility data. Your live portal connects to your actual financial, operational, and census data feeds.
Walk through a building president's morning and see how the portal transforms the first 30 minutes of your day.
Day-in-the-Life Scenario
interactive
Section 06Calculate Your ROI
A deeper look at the financial impact of JockiBox across your organization. Adjust the sliders and watch the savings update in real time.
Enhanced ROI Calculator
interactive
Section 10Building Comparison Showdown
Pick two buildings and see them go head-to-head across six key performance metrics.
Building Comparison Showdown
interactive
Section 11Before & After JockiBox
Drag the slider left and right to compare the old way against the JockiBox way. Same question, completely different experience.
With JockiBox
You: "What was our cost per patient day last month?"
Your cost per patient day for June 2026 was $287.40, down 3.2% from May. Nursing labor accounts for 62% of total cost at $178.19 PPD. Below is your full breakdown with budget variance.
Cost PPD
$287
vs Budget
-3.2%
Labor PPD
$178
Time: ~8 seconds
One question. Instant answer. Real data.
Without JockiBox
From: accounting@facility.com Subject: RE: RE: RE: June PPD numbers Date: July 9, 2026 (3 days after request)
"Attached is the spreadsheet. Let me know if you need the updated version -- the census numbers were wrong in the first file."
A
B
C
D
E
1
GL Code
Description
Jun-26
May-26
Var
2
6100
Nursing Wages
482,109
491,230
-9,121
3
6110
Nursing OT
38,442
41,003
-2,561
4
6200
Dietary
89,201
87,650
1,551
5
6300
Housekeeping
42,880
43,102
-222
6
...
... 47 more rows
...
...
...
Steps:
Open email from accounting
Download Excel attachment
Find the right tab
Look up the GL codes
Cross-reference census data
Calculate PPD manually
Format for the board meeting
Realize the data is already 2 weeks old
Time: ~45 minutes (plus 3 days waiting)
Section 12What Would You Ask?
Read the scenario, then type the question you would ask your portal. After you submit, we will show you the suggested query and a mock portal response.